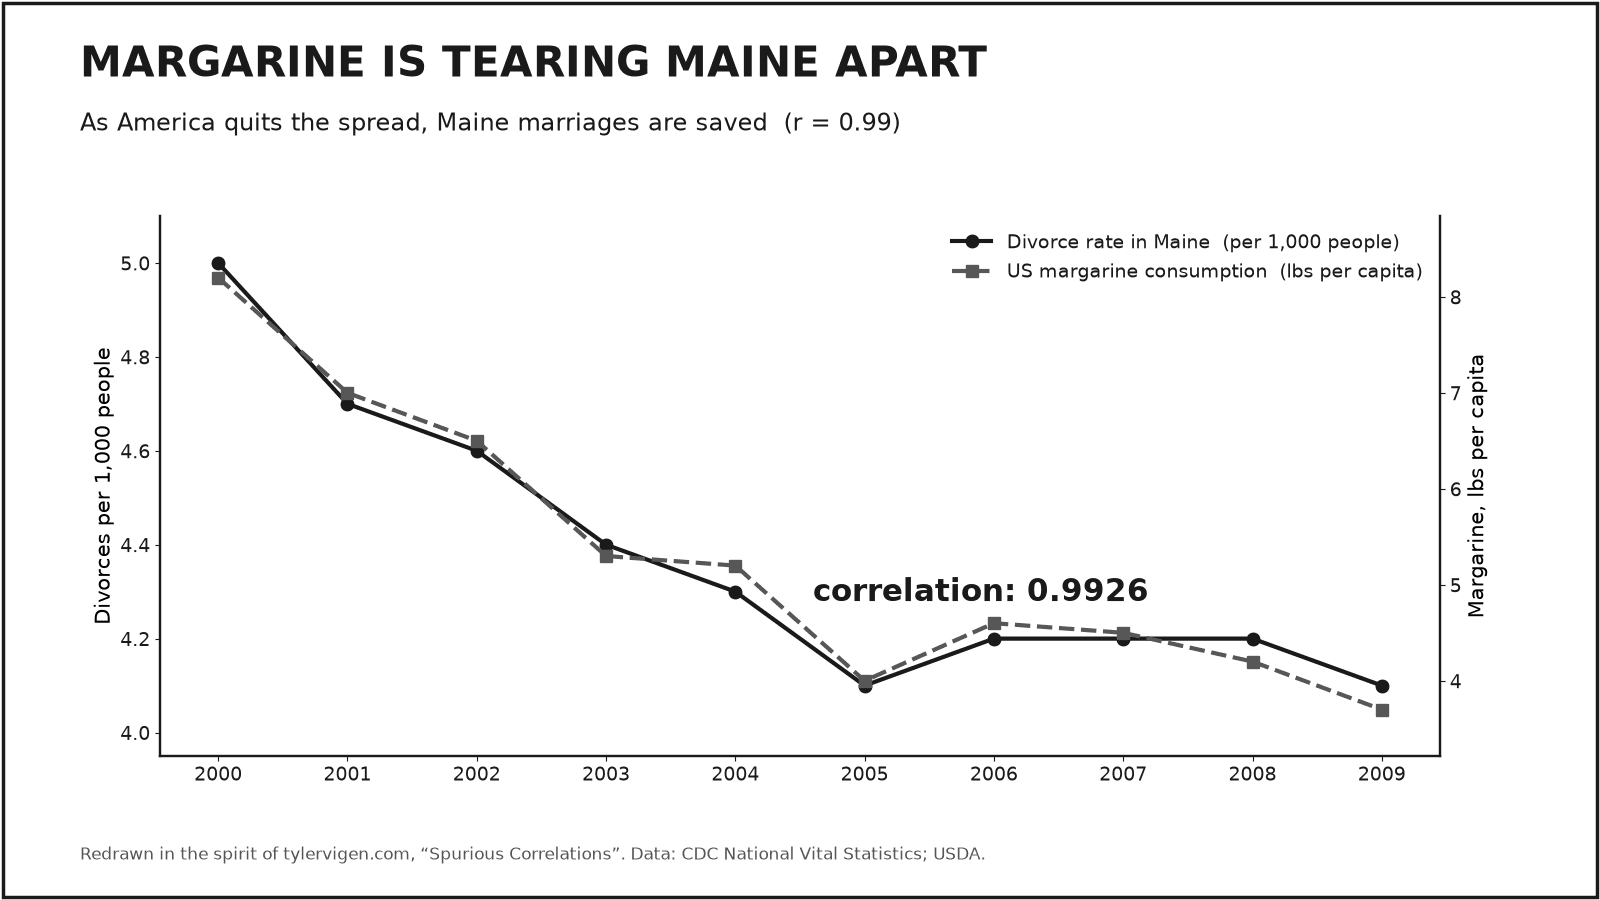
Margarine and the divorce rate in Maine: a love story
US margarine consumption and Maine’s divorce rate, overlaid on hand-tuned dual axes until a 0.99 correlation looks like a national scandal.
Spurious Correlations (Tyler Vigen), 2014
Axis crimes
Two axes, one narrative, infinite flexibility.
a.k.a. secondary axis · the axis of evil
Put one series on the left axis and another on the right, and you get two free knobs to turn until the lines cross exactly where the story needs them to. The correlation you “see” is a design decision, not a finding.
Index both series to a common baseline (like % change from a start date), or just use two small charts side by side.
US margarine consumption and Maine’s divorce rate, overlaid on hand-tuned dual axes until a 0.99 correlation looks like a national scandal.