All techniques
Framing & context
The extrapolated trend
The data stops. The line does not.
a.k.a. the trend line · extending the trendline · linear projection · the forecast drawn as data · out-of-sample · add a trendline · the straight line to 2050 · R² as proof · the fitted hockey stick · if current trends continue
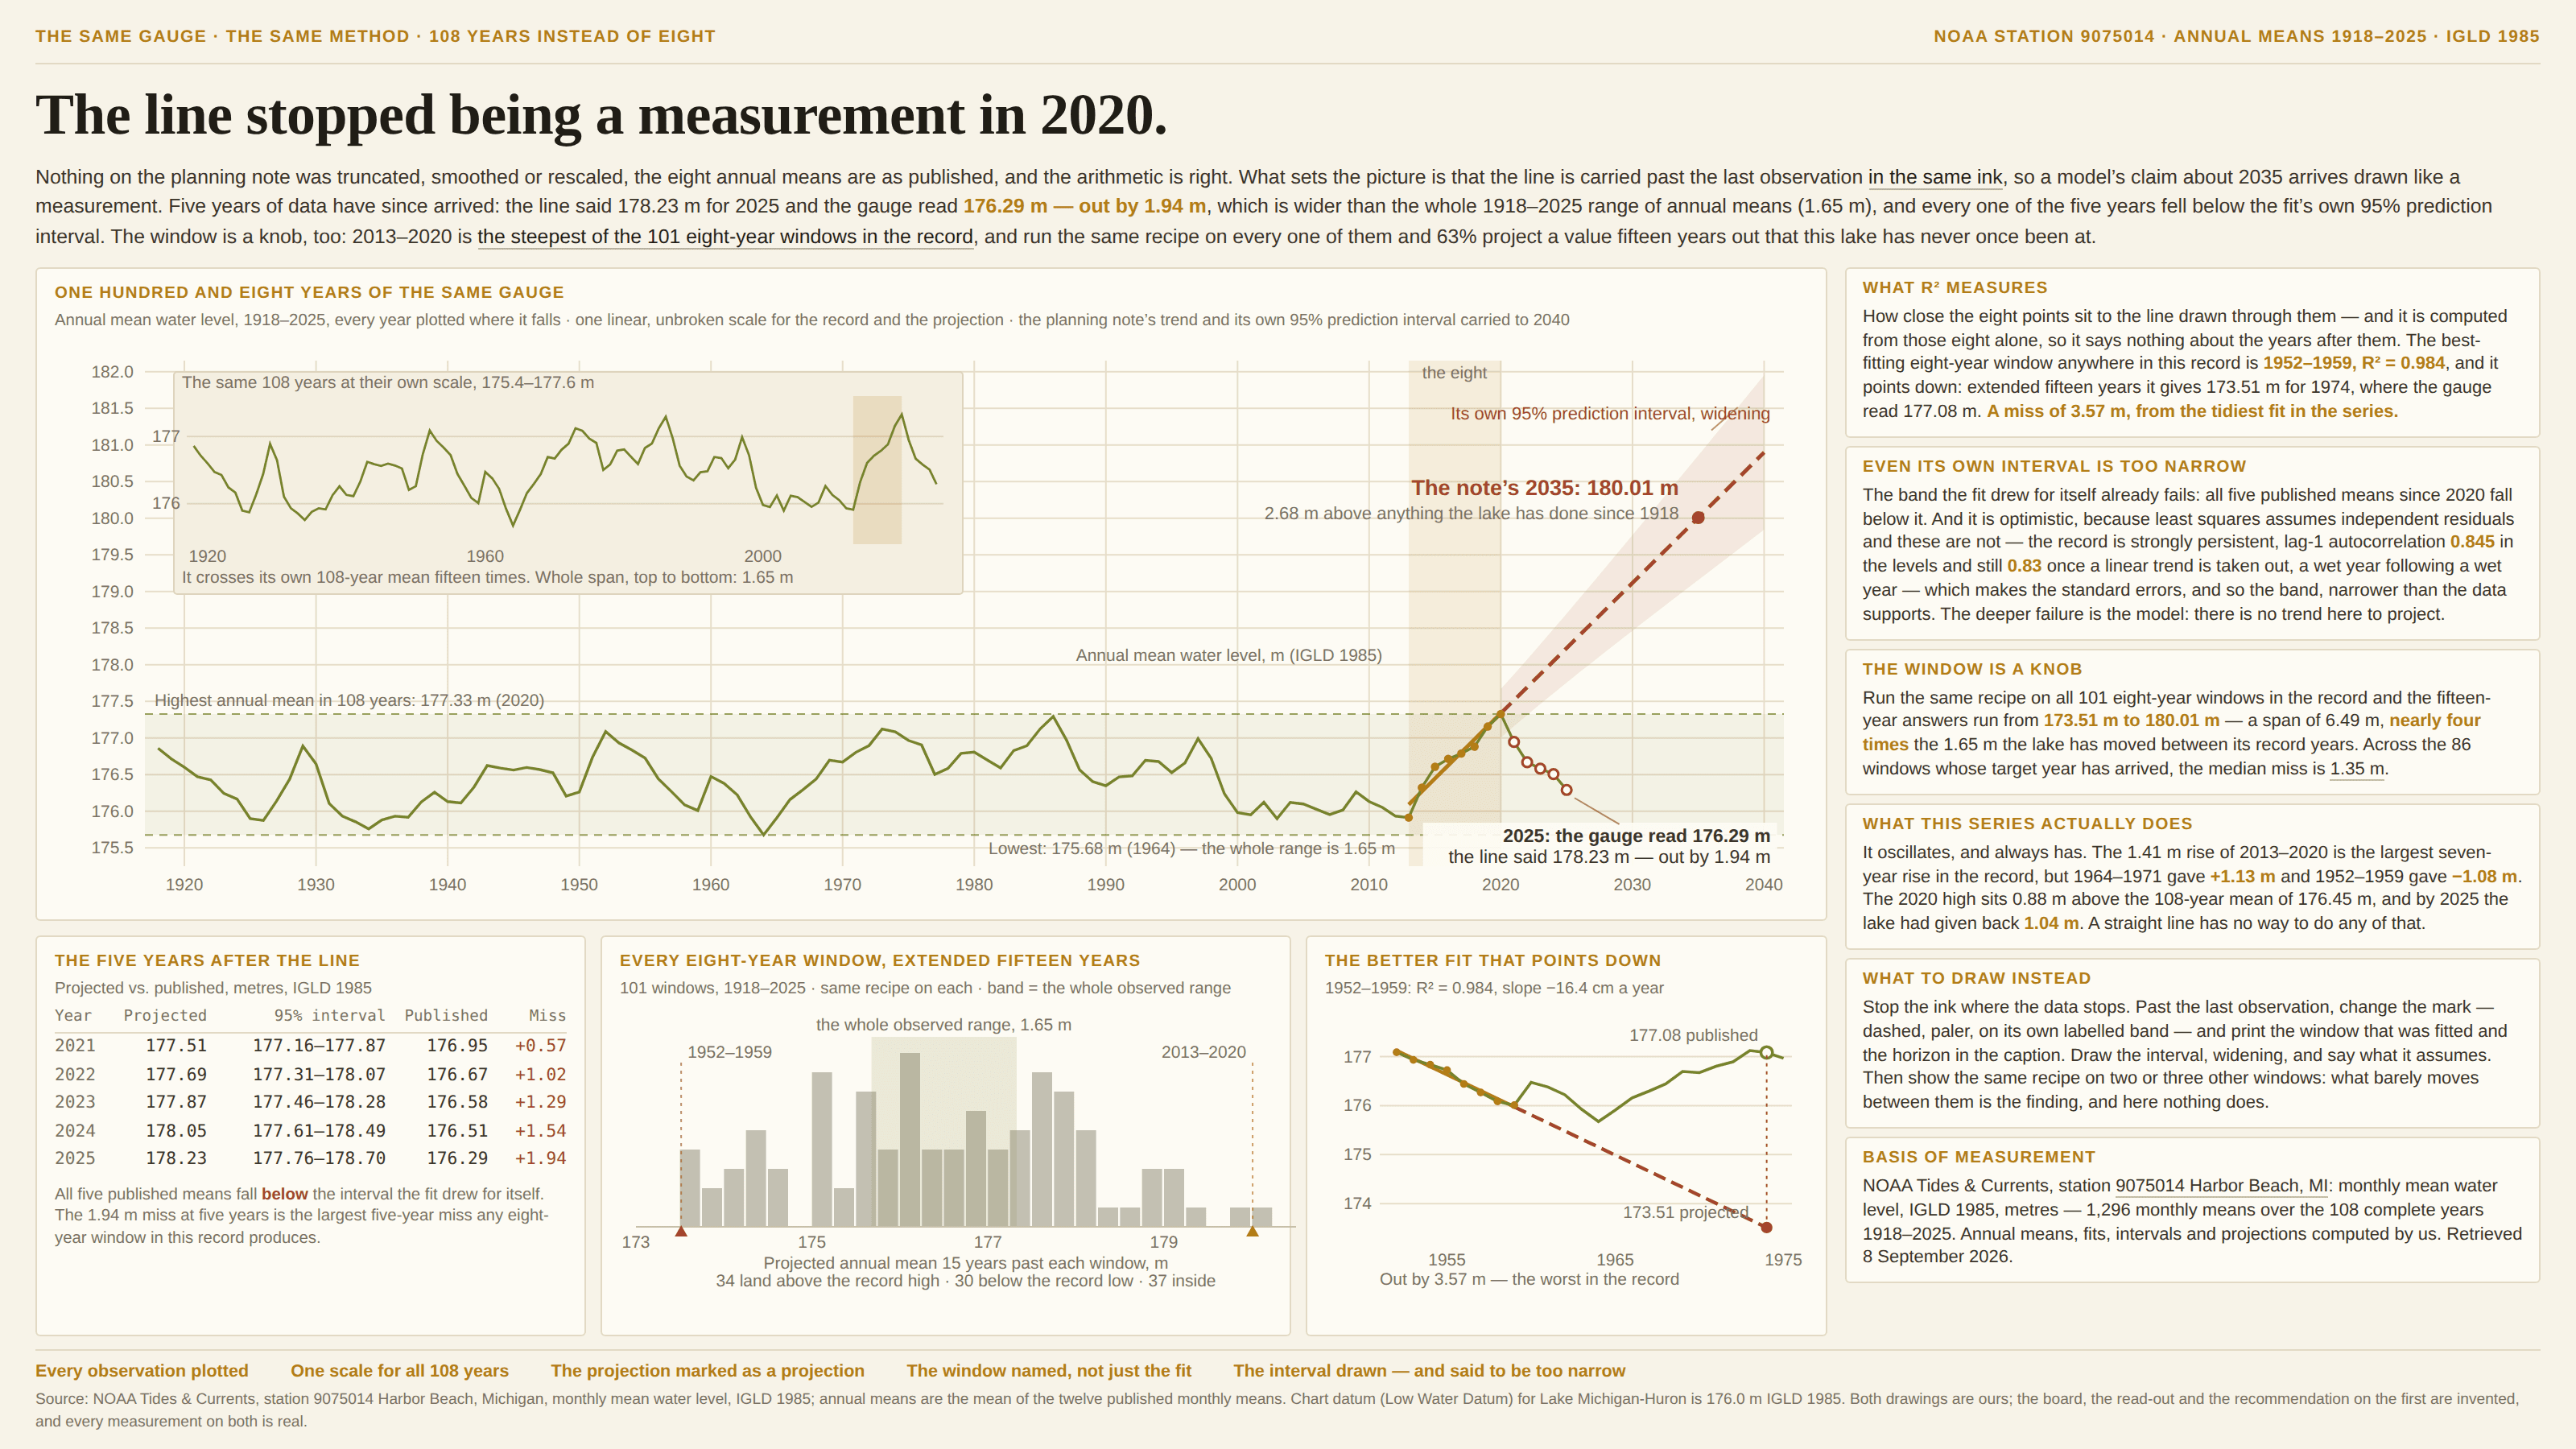
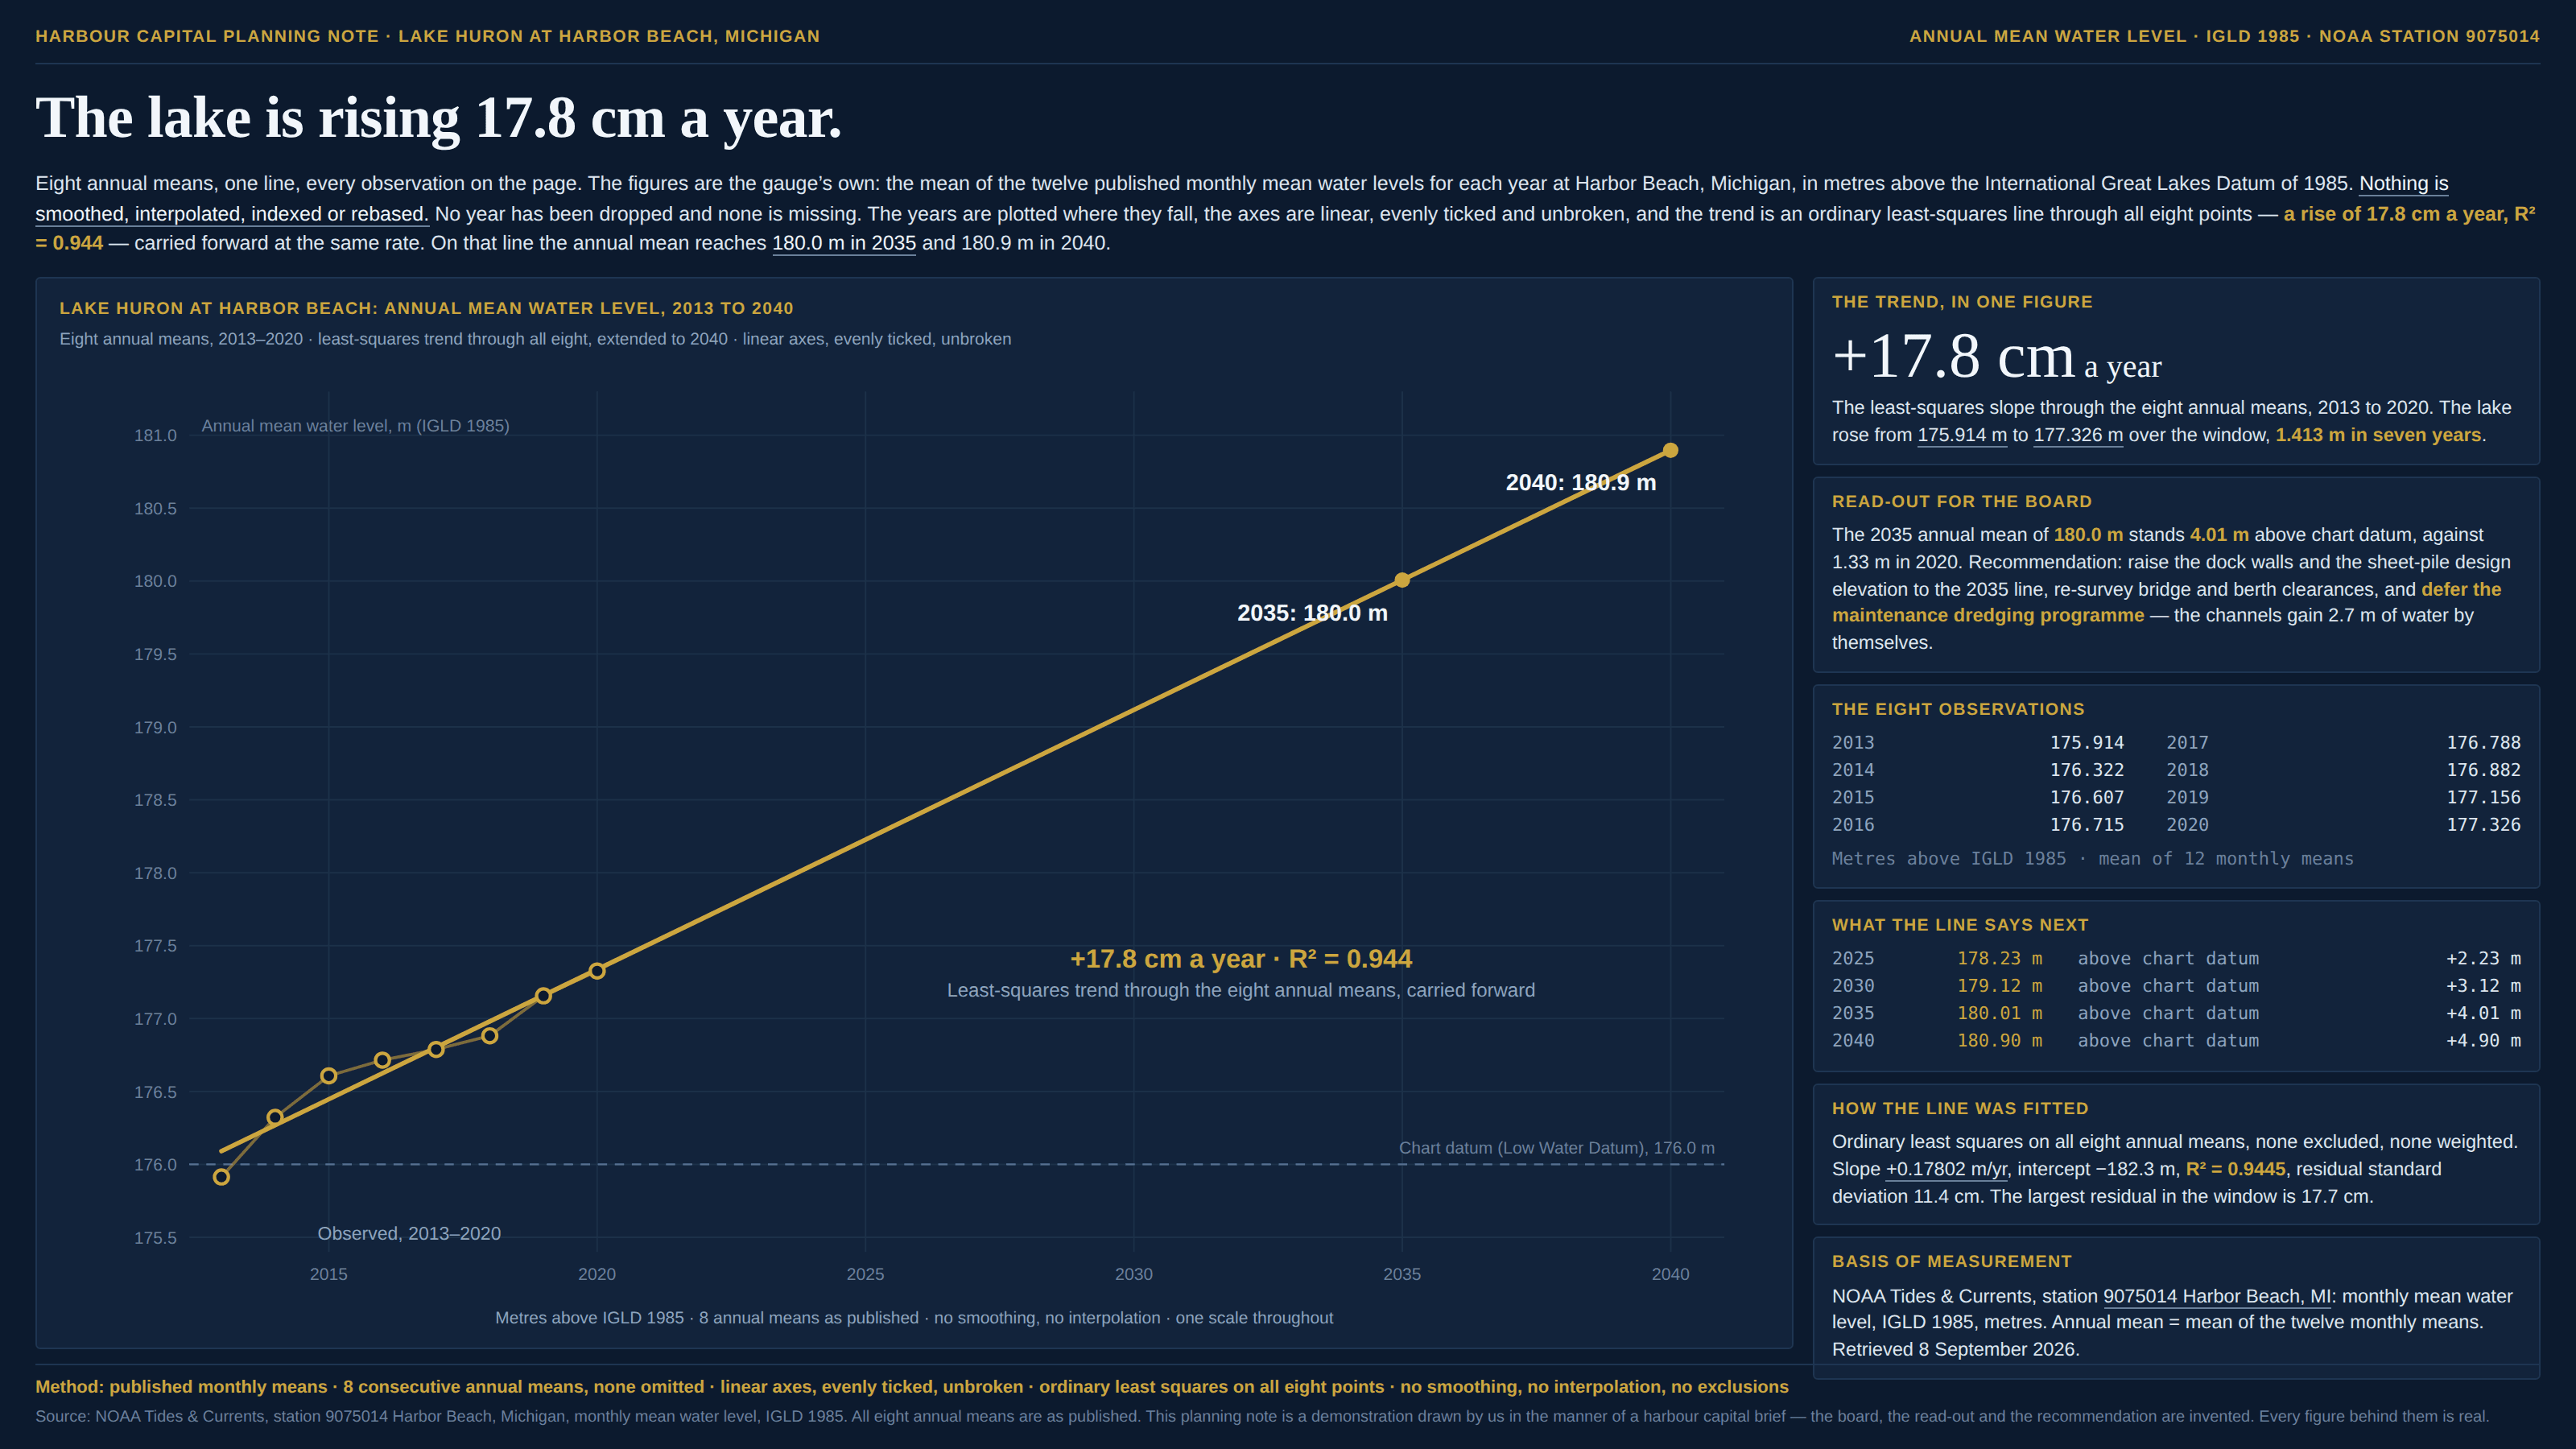
A fitted line is a summary of the points it was fitted to, and of nothing else. Carried past the last observation it stops summarising and starts claiming, about years nobody measured — and it is almost always drawn in the same ink, at the same weight, as the measurements, so the part of the chart that is evidence and the part that is arithmetic arrive looking identical. Three settings decide what that arithmetic says, and charts almost never print any of them: the window that was fitted, the shape that was assumed, and how far the line was carried. Move the window a few years and the slope moves with it; swap a straight line for a curve that fits the same points just as well and the two agree across the data and separate afterwards; extend the horizon and every disagreement grows in proportion. The statistic quoted in its defence measures none of that. R² says how close the fitted points sit to the line drawn through them, it is computed from those points alone, and a series can hand you a tidy fit over any eight years you like while doing something else entirely in the ninth. What ought to be drawn alongside — the uncertainty, widening with distance — usually is not, and where it is, it is generally too narrow, because least squares assumes each year is an independent draw and most real series are nothing of the kind: a wet year follows a wet year, a busy quarter follows a busy quarter, and serial correlation like that makes the honest band wider than the computed one.
How to spot it
- Find where the data stops. That point is the whole finding, and on many charts nothing marks it — same colour, same weight, same line, straight through the last observation and out the other side.
- Ask what window was fitted, then move it. Five years earlier, five years later, twice as long: if the slope survives, it was in the data; if it swings, it was in the window.
- R² offered as evidence about the future. It is an in-sample measure and says nothing about the years after the ones it was computed from — the tidiest fit in a record can be the one pointing the wrong way.
- Compare the projection against the range the series has actually occupied. A line that arrives somewhere the quantity has never been in its whole recorded history is making a much larger claim than the picture admits.
- A round horizon — 2030, 2050, 2100. Data does not end on those; slides do, and the further the horizon, the more of the number is the model.
- No interval at all, or one that does not widen. Uncertainty about a fitted line grows with distance from the middle of the window, so a band of constant width is decoration.
- Ask what the quantity is allowed to do. Shares cannot pass 100%, counts cannot go below zero, adoption curves saturate, and plenty of series simply oscillate — a straight line can do none of that, and the mechanism is usually known before the chart is drawn.
- The shape is a choice as much as the window is. Linear, exponential and logistic fits can agree closely over the fitted points and disagree wildly beyond them, so a projection is a statement about which of those was assumed.
- Keep it apart from the cherry-picked window, which is its neighbour: there the choice is which observations to show, while here every observation can be shown and honestly fitted, and the line still becomes fiction the moment it passes the last one. The two ride together often, since the window that gets fitted is frequently the steepest one available.
- Its other neighbour is phantom precision, and the difference is what the missing uncertainty is about: there it is uncertainty in an estimate quoted to three decimals, while here it is uncertainty that grows with every year of distance from the data, so one band cannot be right at both ends of the line.
- Ask whether the window was an extreme one, because regression to the mean is waiting on the other side of it: an unusually steep stretch is unusual partly by luck, the next stretch is typically less so, and a projection fitted to the steepest years in a record is the one most likely to be followed by a reversion.
The fix
Stop the ink where the data stops. Past the last observation the mark should change — dashed, paler, on its own labelled band, with a rule and a word at the boundary — so that a reader glancing at the picture can see, without reading anything, which part was measured. Then say what the projection is made of, in the caption, the way you print a unit: the window that was fitted, the shape that was assumed, and the horizon. Draw the interval, widening with distance, and say what it assumes, since a band computed on independent residuals is optimistic for almost any series collected over time, and a reader told that is better served than one shown nothing. The cheapest honest check is to run the same recipe on two or three other windows and put the results on the same axes: what barely moves between them is the finding, and where they fan out across the whole plausible range of the quantity, that fan is the answer and the single line was never going to be. Prefer a projection with a mechanism behind it to one with a slope behind it — a published forecast, a cohort model, a capacity constraint, a physical bound — and where such a forecast already exists, use it and credit it rather than fitting your own. Ask what would have to be true for the line to hold, out loud, because that sentence is usually where the extrapolation dies. And keep the two claims apart in the words as well as in the ink: what the series has done between two named dates is a measurement and survives everything, while what it will do next is a model — so where a decision turns on the second, quote the range rather than the line, and say whose model it came from.
In the gallery