All techniques
Axis crimes
The logarithmic unit
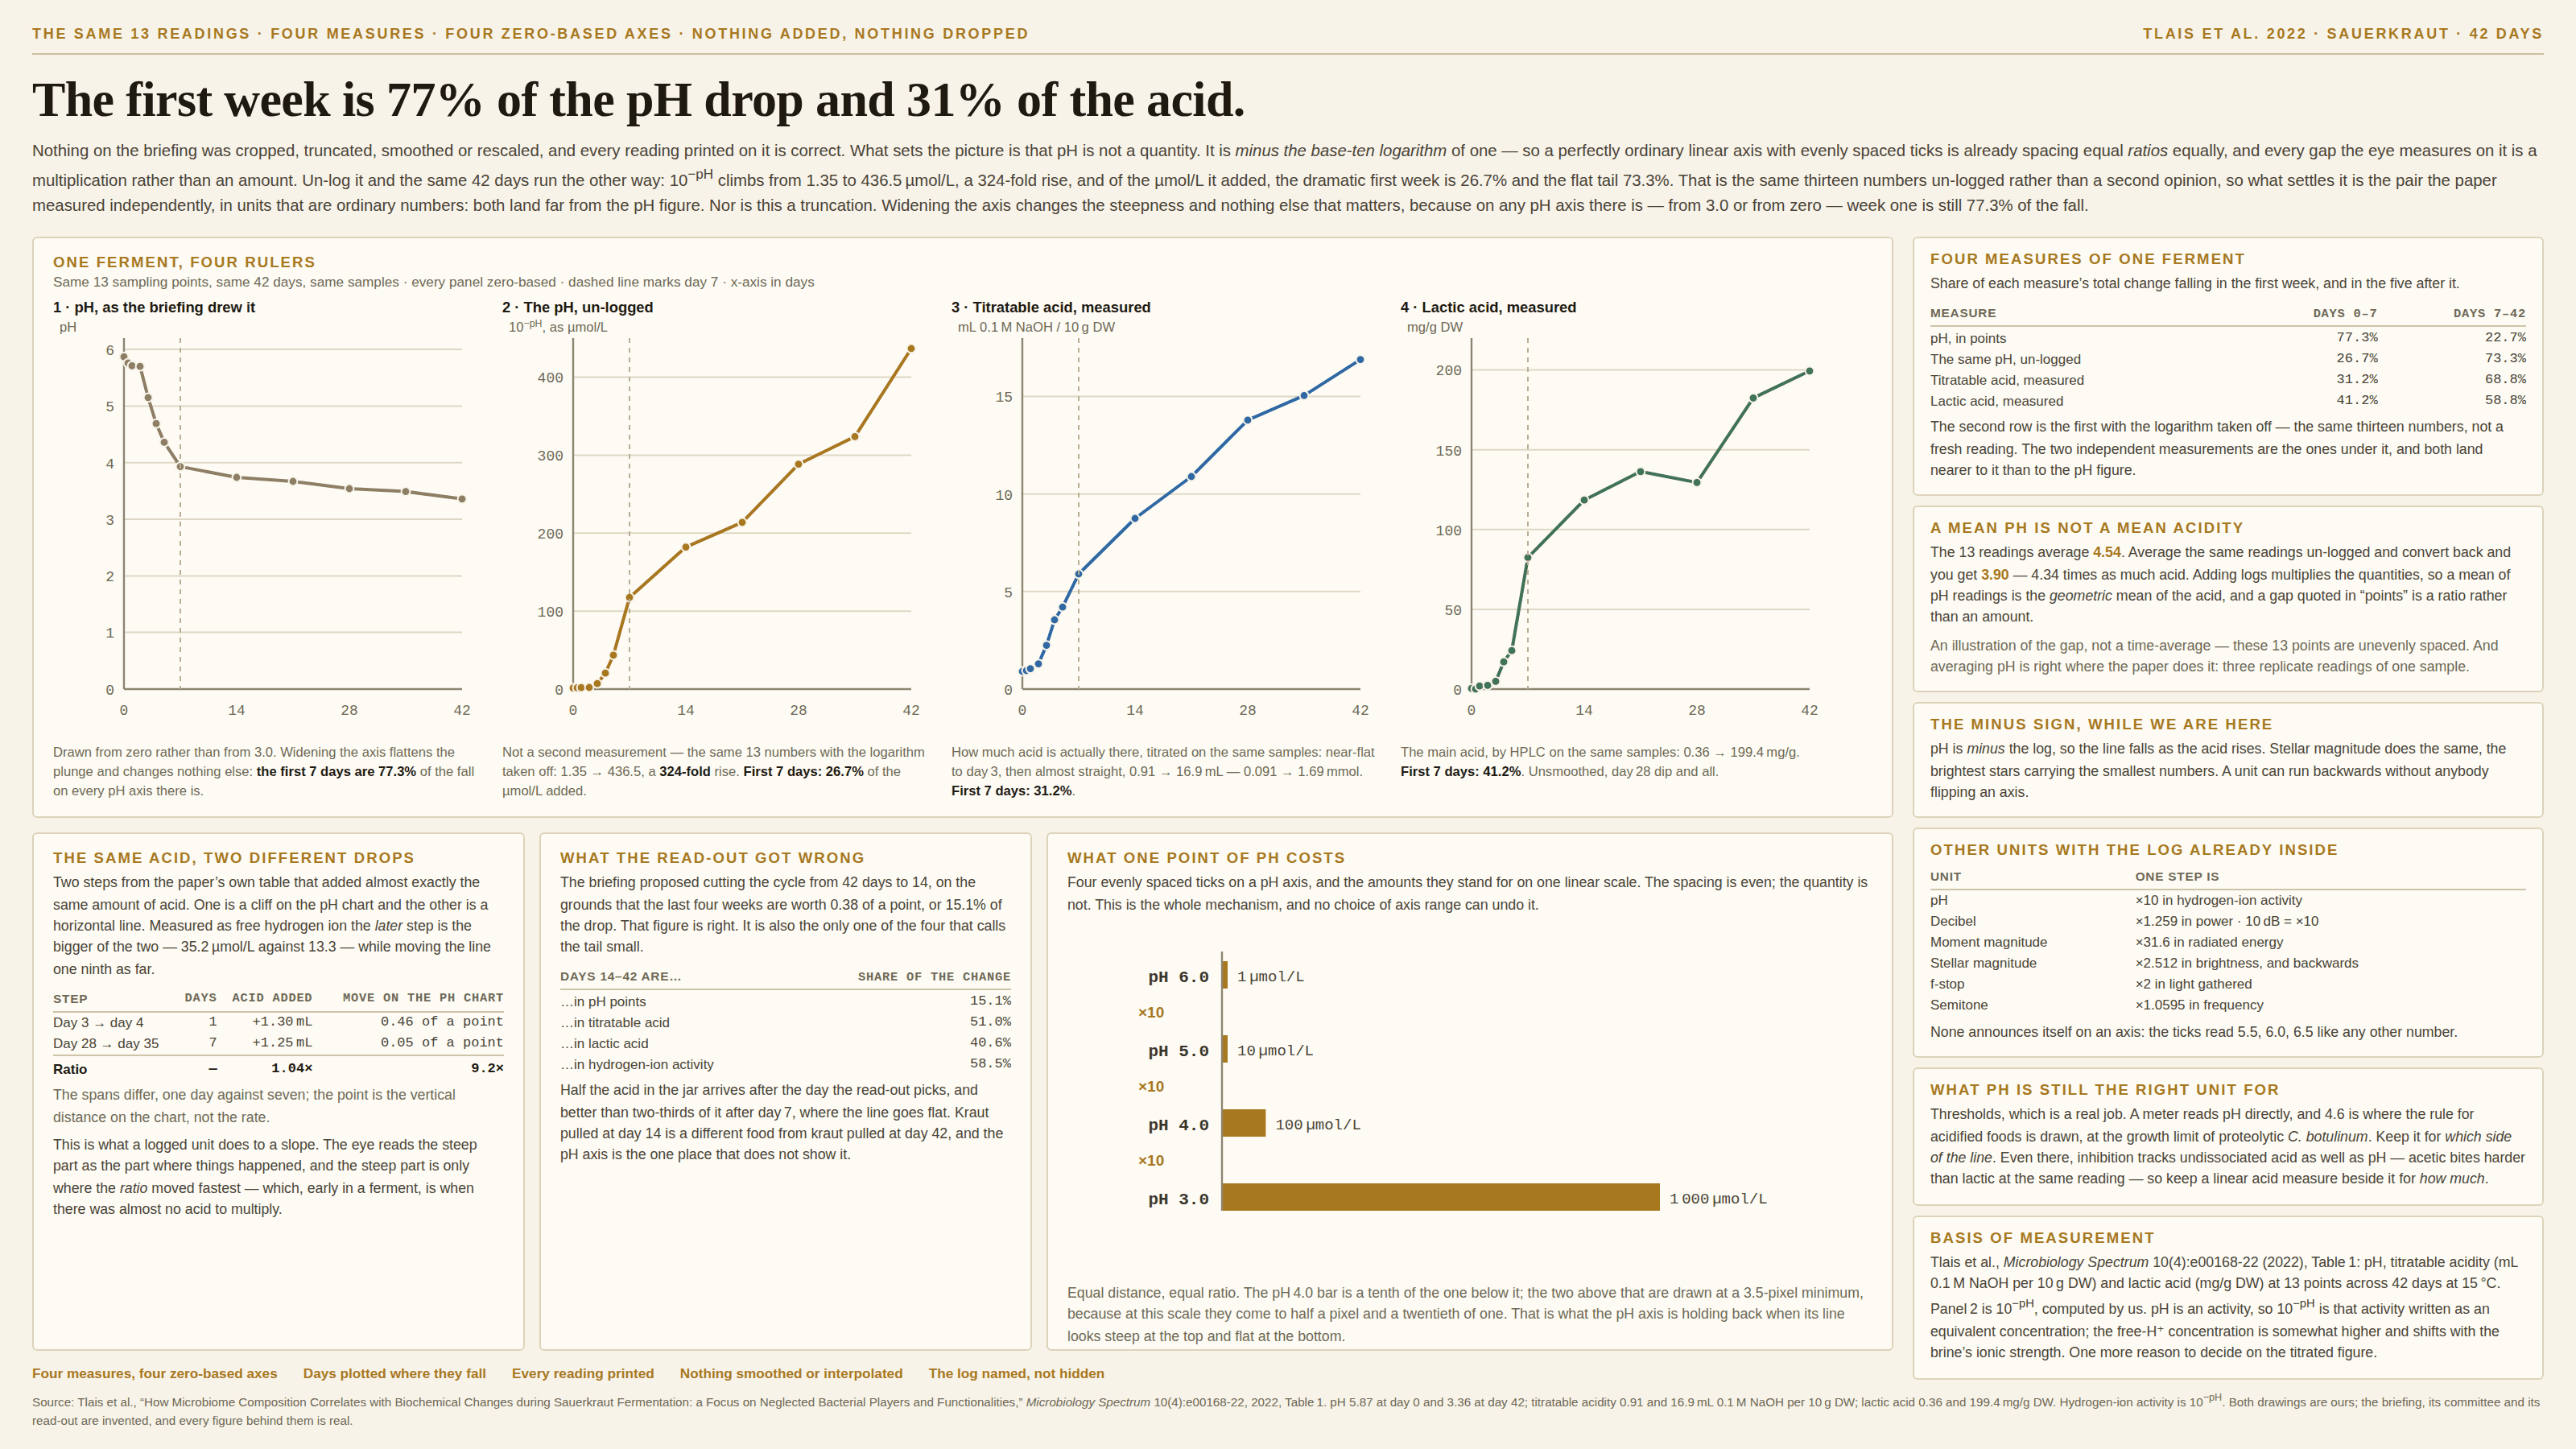
The axis is linear. The unit is already a logarithm.
a.k.a. pH · decibels · the Richter scale · moment magnitude · stellar magnitude · f-stops · semitones · the log in the unit · the already-logged variable · ratio units
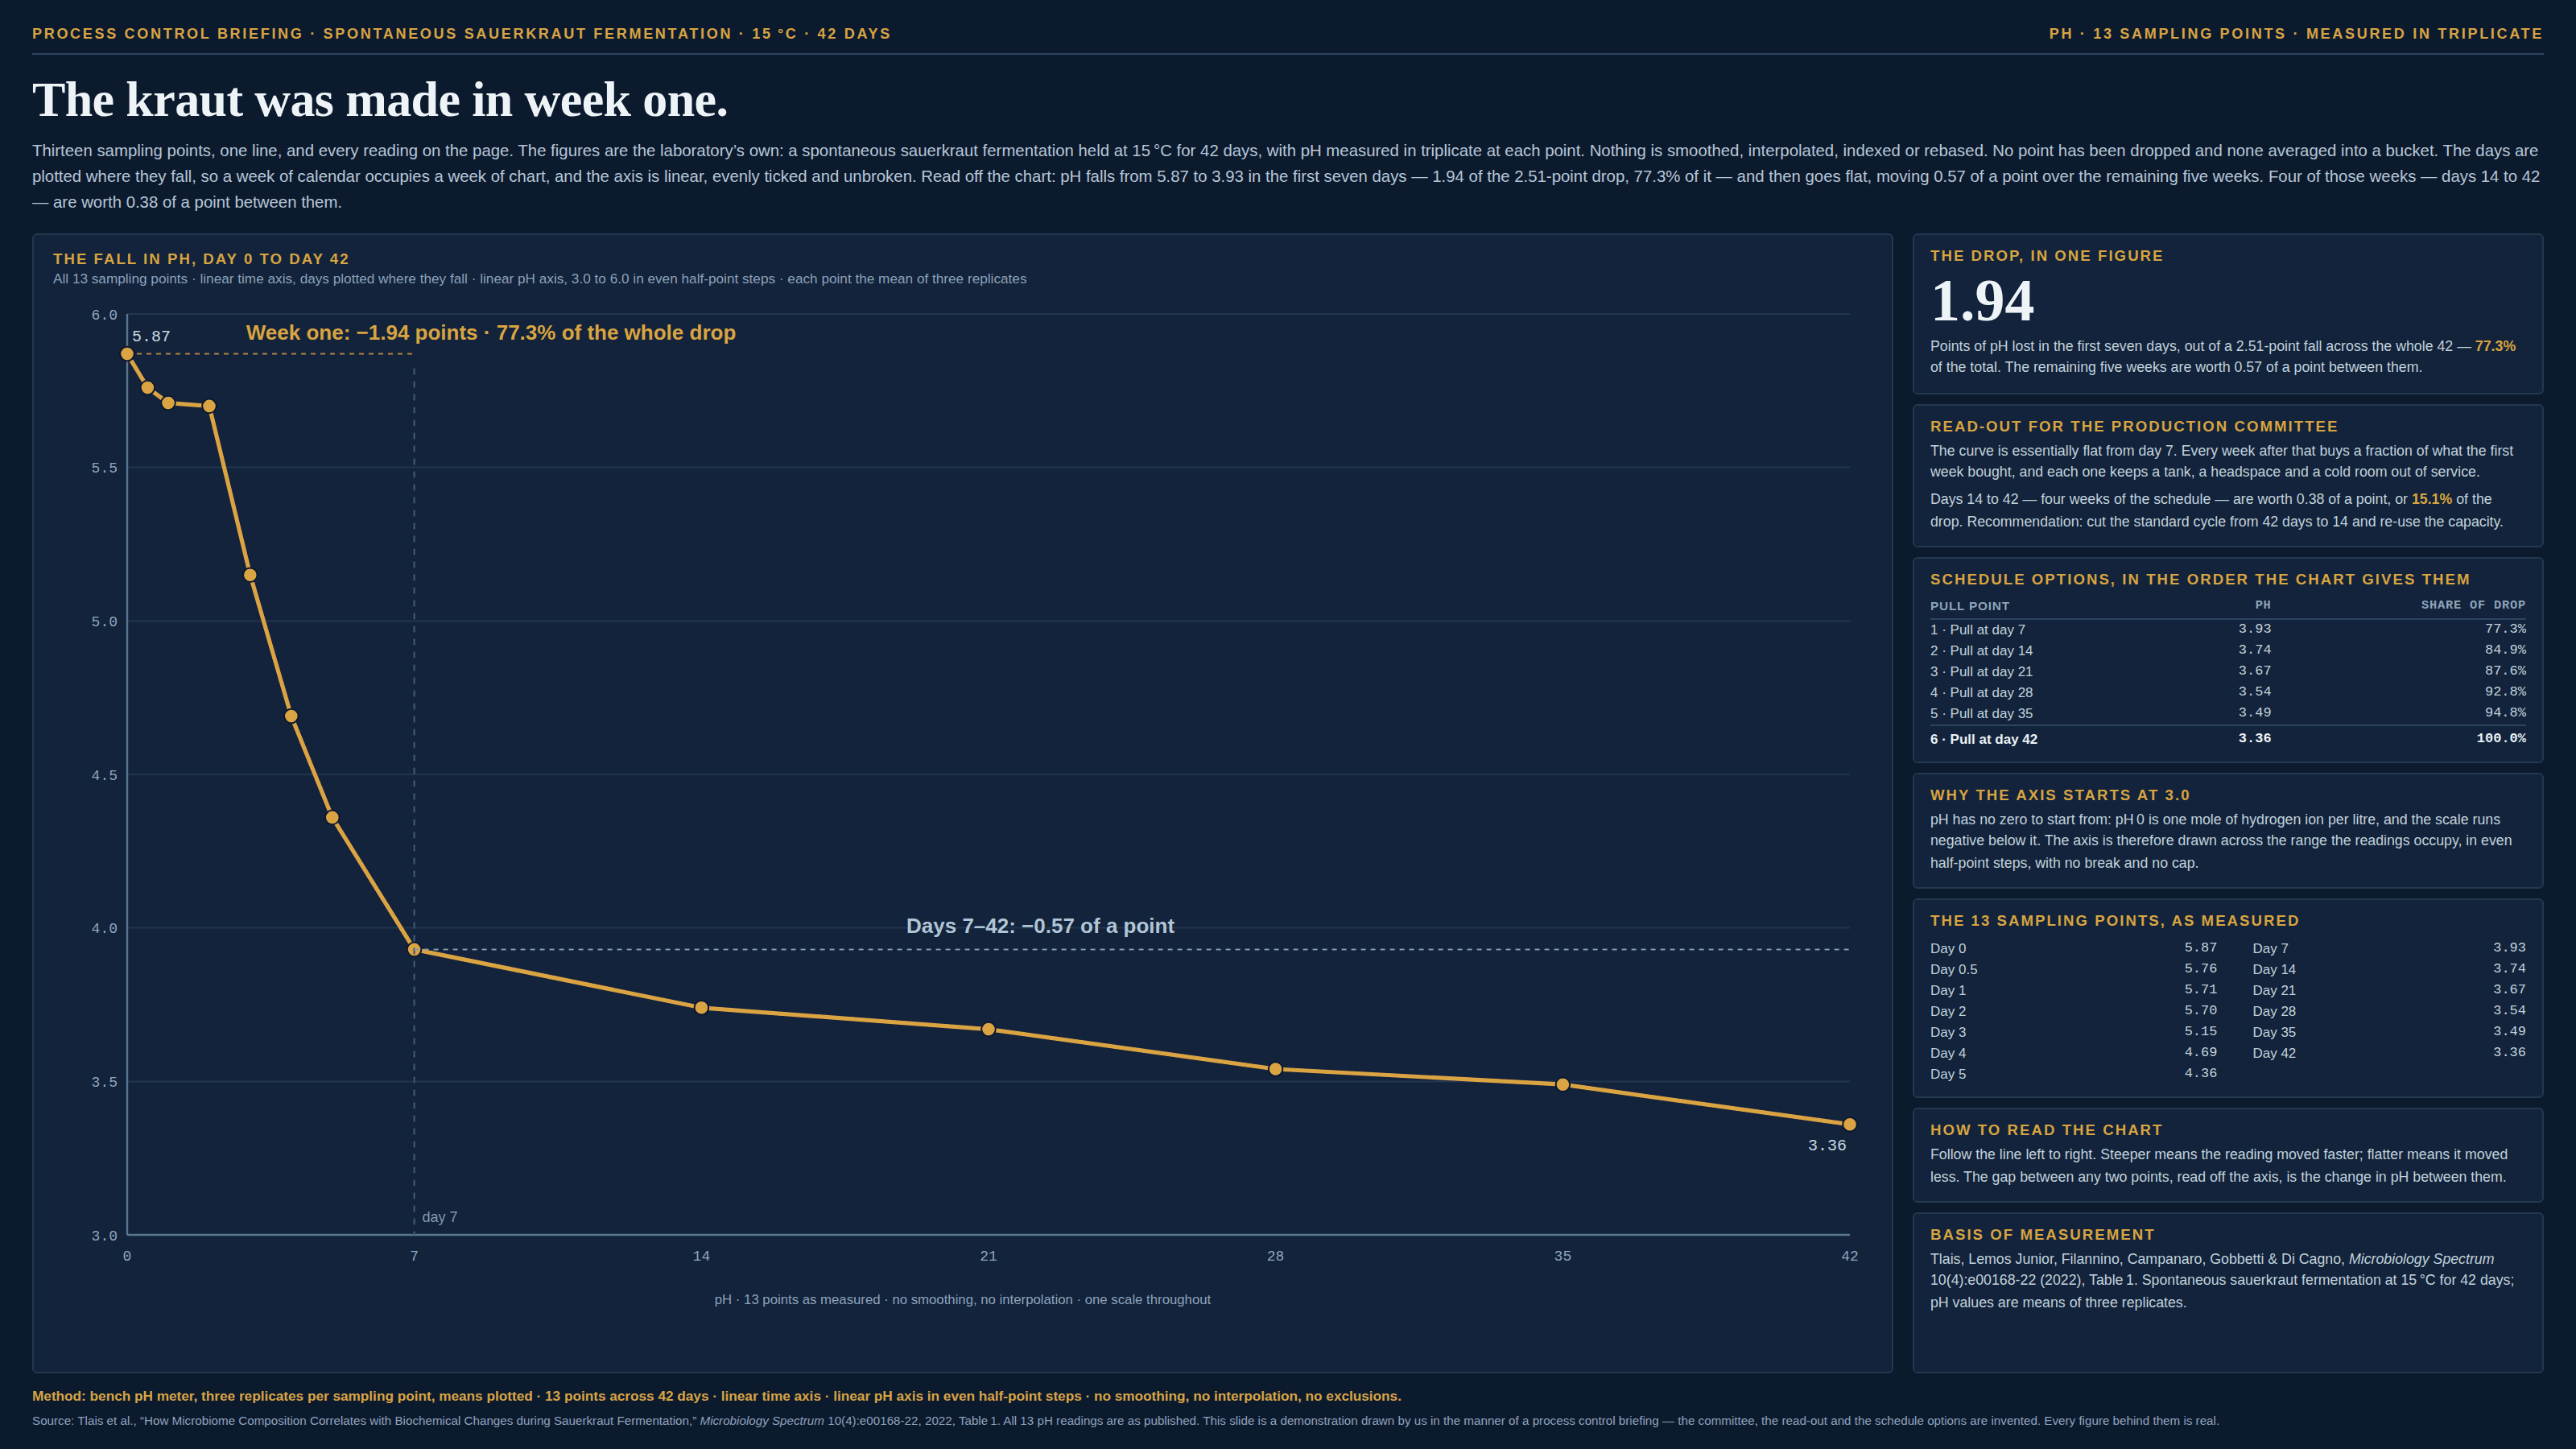
A log axis at least announces itself: the ticks read 1, 10, 100, and a reader who looks can see what was done. This one hides a step earlier, inside the measurement, where no axis setting can reach it. pH, the decibel, earthquake magnitude, stellar magnitude, the f-stop and the semitone are not quantities but logarithms of quantities, agreed on long ago precisely because the numbers underneath span too many orders of magnitude to carry around. Plot one on a perfectly ordinary linear axis and that axis is quietly doing what a log axis does: equal distances are equal ratios, so every gap the eye measures is a multiplication and no difference on the chart is an amount. Three things follow, and each of them survives an audit. Adding logs multiplies the quantities, so a mean of pH readings is the geometric mean of the acid rather than the arithmetic one, and a gap quoted in “points” is a ratio rather than an amount. A curve that flattens has not slowed down — it has stopped multiplying as fast, while the quantity underneath can be accelerating, and the flat stretch is often where most of it arrives. And several of these units carry a minus sign as well, so the line falls while the thing it measures rises. Unlike a truncation, none of it can be fixed by widening the range: draw the pH from zero, or across the whole 0–14, and the picture is flatter rather than fairer, because the compression lives in the unit and not in the frame.
How to spot it
- Ask what the unit is a logarithm of. pH is minus the log of hydrogen-ion activity; a decibel is ten times the log of a power ratio; a magnitude step is ×31.6 in earthquake energy and ×2.512 in starlight; an f-stop is ×2 in light and a semitone ×1.0595 in frequency.
- Evenly spaced, innocuous ticks — 6.0, 5.5, 5.0 — with no 10, 100 or 1,000 anywhere on the axis. That is the whole disguise, and it is why a log axis is far easier to catch than a logged unit.
- A curve that goes flat. In a logged unit, flat means the ratio stopped moving quickly; the amount per week can be climbing throughout, and the flat stretch is often where most of it arrives.
- Arithmetic on the values: an average pH, a mean magnitude, a difference quoted in points or dB, a percentage change in either. Adding logs multiplies the quantities, so every one of those is answering a multiplicative question — convert, do the sum, convert back.
- Bars. These units have no meaningful zero to grow from (pH 0 is one mole per litre and pH runs negative; 0 dB is a chosen reference), so a bar length encodes a ratio to whatever baseline was picked, never an amount.
- A minus sign in the definition. pH and stellar magnitude both run backwards, so the smaller number is the larger quantity and the chart falls as the thing rises — an inversion nobody had to draw.
- Look for a second measurement of the same thing in a linear unit sitting in the same source: titratable acidity beside pH, sound intensity beside decibels, seismic moment beside magnitude. Where the two disagree about the shape of the curve, the unit is doing it.
- The tell that separates it from a truncated axis: widen the axis to the full range of the unit and nothing about the shape changes.
The fix
Plot the quantity the reader is being asked about. If the question is how much acid, how much sound energy, how much light, put the un-logged quantity on a linear zero-based axis and let it be the hockey stick it is — the change of shape between the two pictures is not a distortion being introduced, it is the one the logged unit was applying all along. Where the range genuinely spans orders of magnitude and the linear chart collapses into a line along the bottom, the honest answer is a log axis drawn by the rules under “The log scale” — which at least prints its decades on the ticks, where a logged unit prints nothing at all. Keep the logged unit where it is the thing people actually act on, because often it is: pH 4.6 is where the rule for acidified foods is drawn, an 85 dB exposure limit is a real limit, and a magnitude is what a building code is written against. The distinction worth holding is between a threshold and an amount — a logged unit answers which side of the line, and only the un-logged quantity answers how far — and even a threshold is worth reading with its linear neighbour in view, since microbial inhibition tracks undissociated acid as well as pH. So say in the caption what the unit is a logarithm of and what one step of it multiplies, the way you would print any other unit, and where a decision turns on an amount, show both charts and take the number off the linear one. Never let the logged values through a mean, a sum, a difference or a growth rate on the way to a slide.
In the gallery