All techniques
Cherry-picking
The early stop
A test allowed to end whenever it is ahead will end whenever it is ahead.
a.k.a. peeking · data peeking · optional stopping · sequential testing · repeated significance testing · continuous monitoring · stopping when significant · interim analysis without adjustment · calling the test early · sample-size fishing
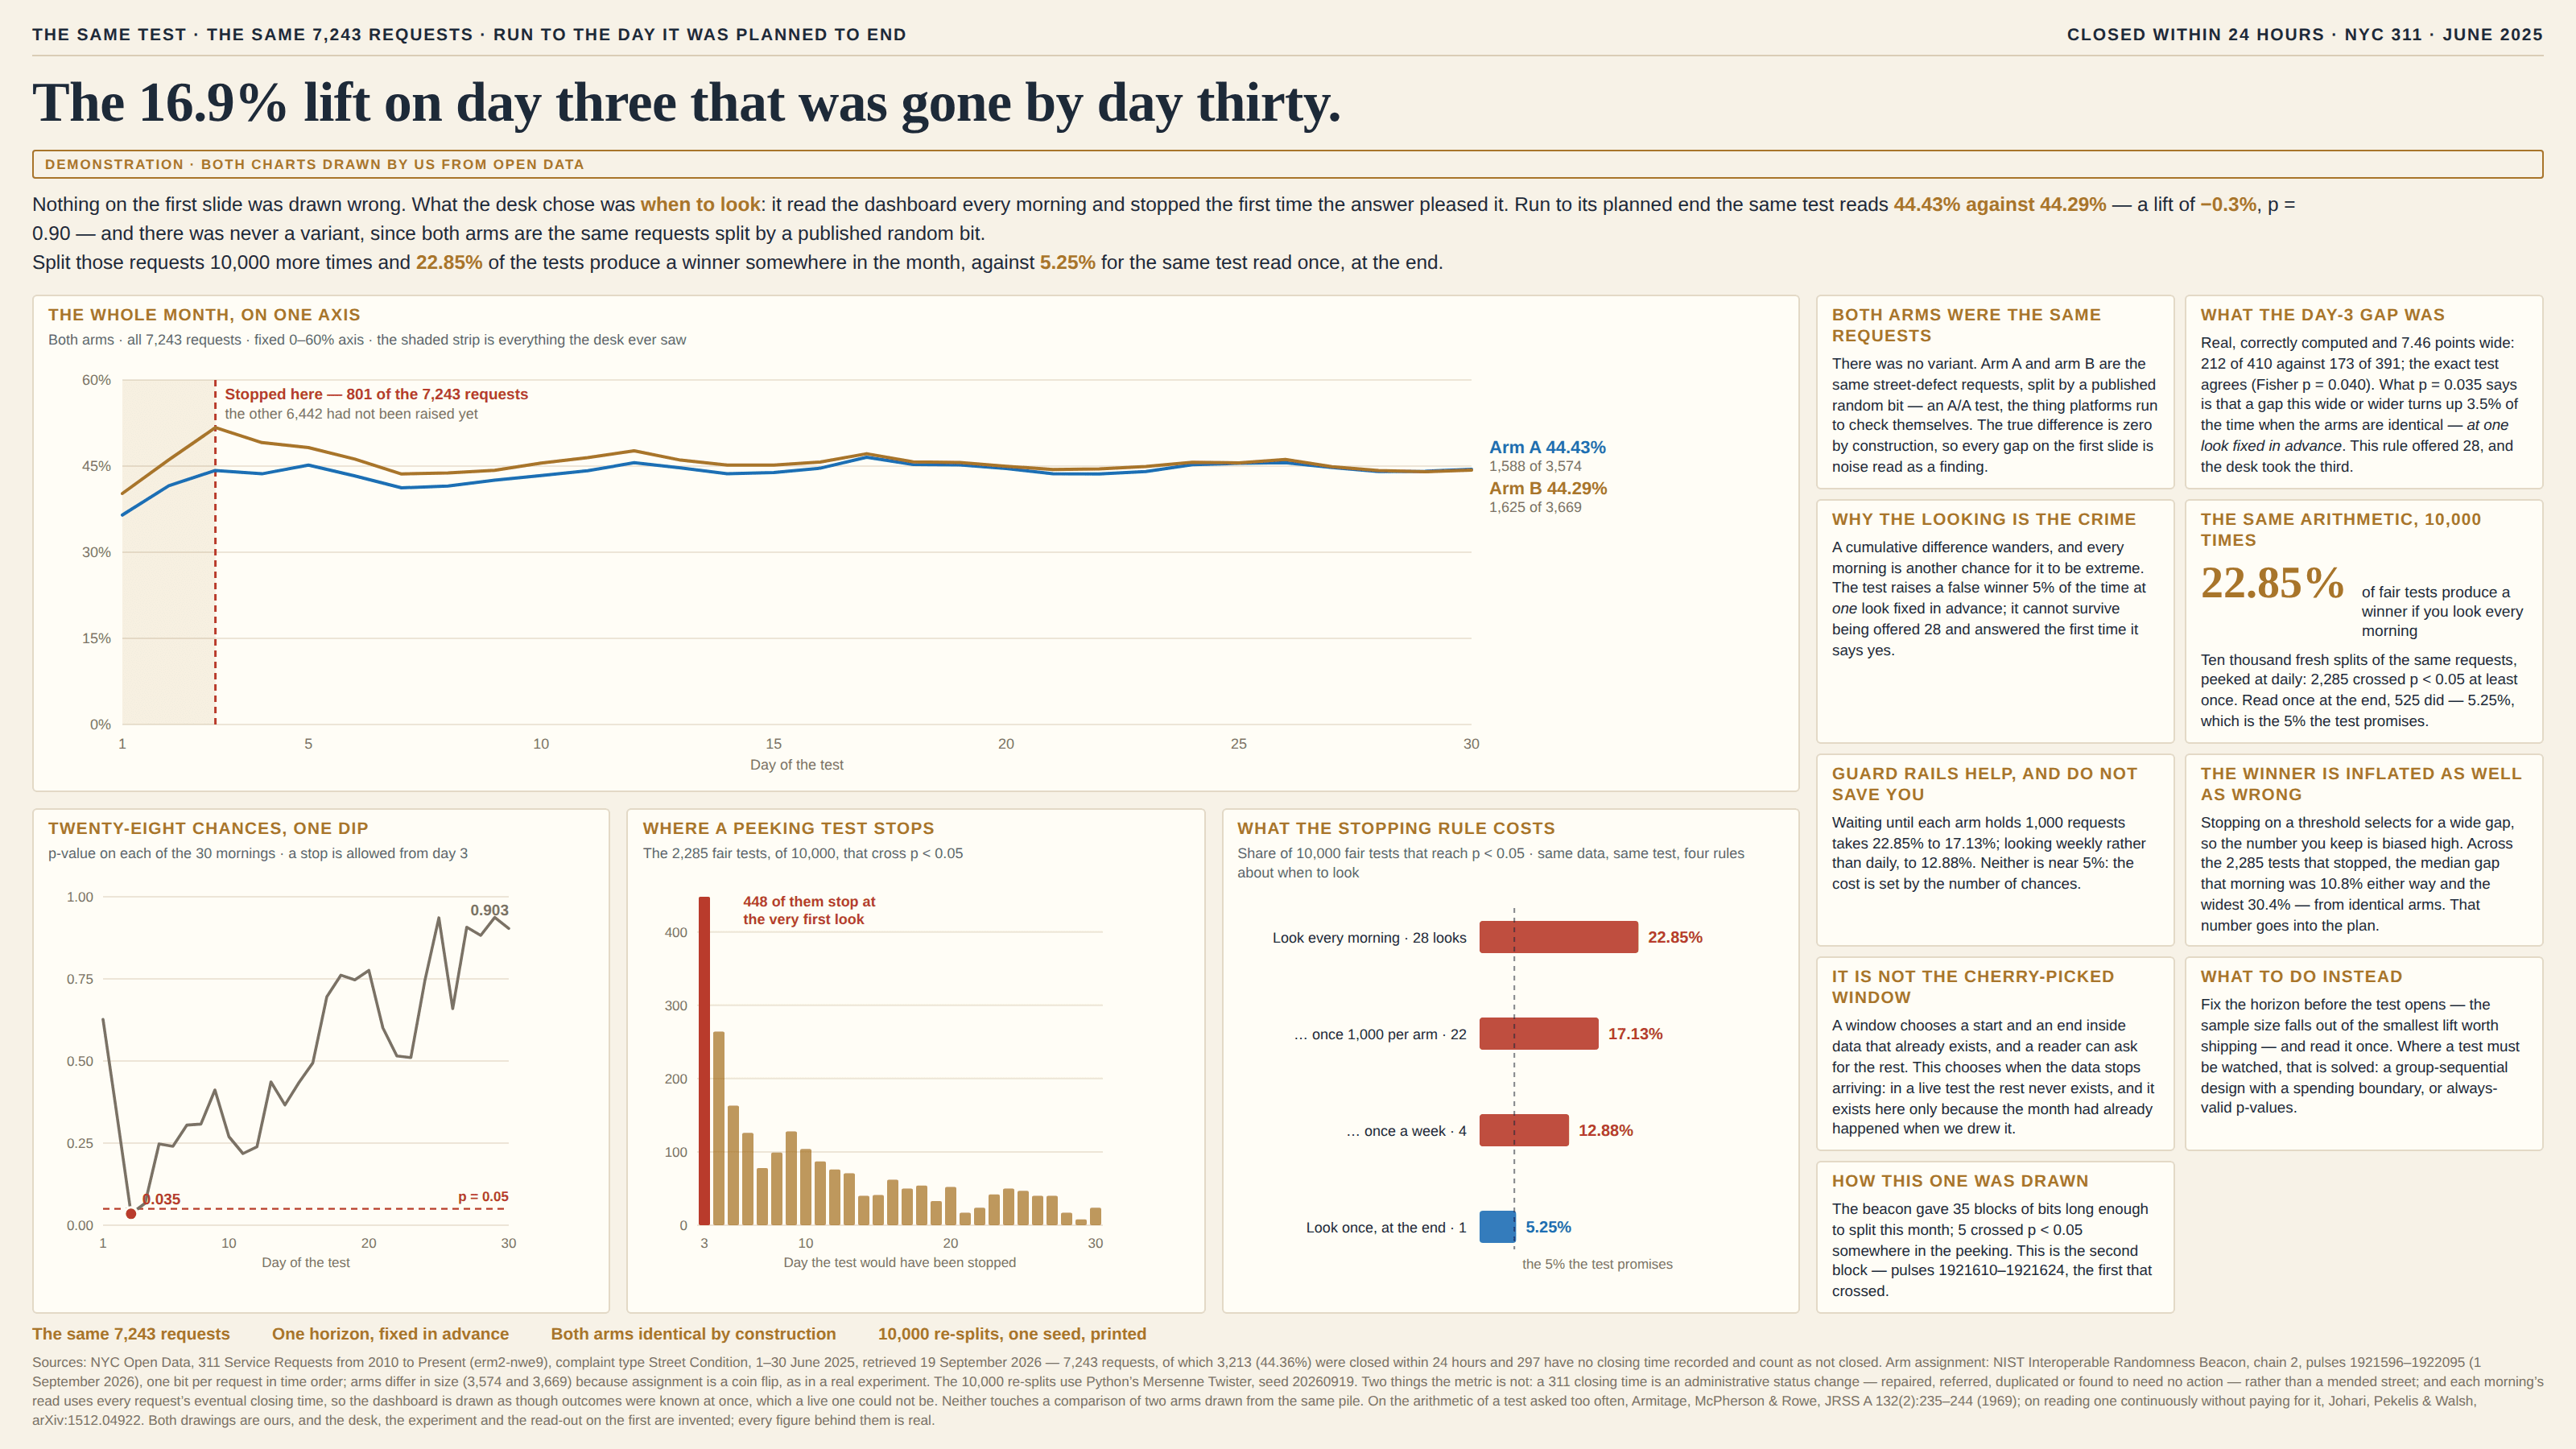
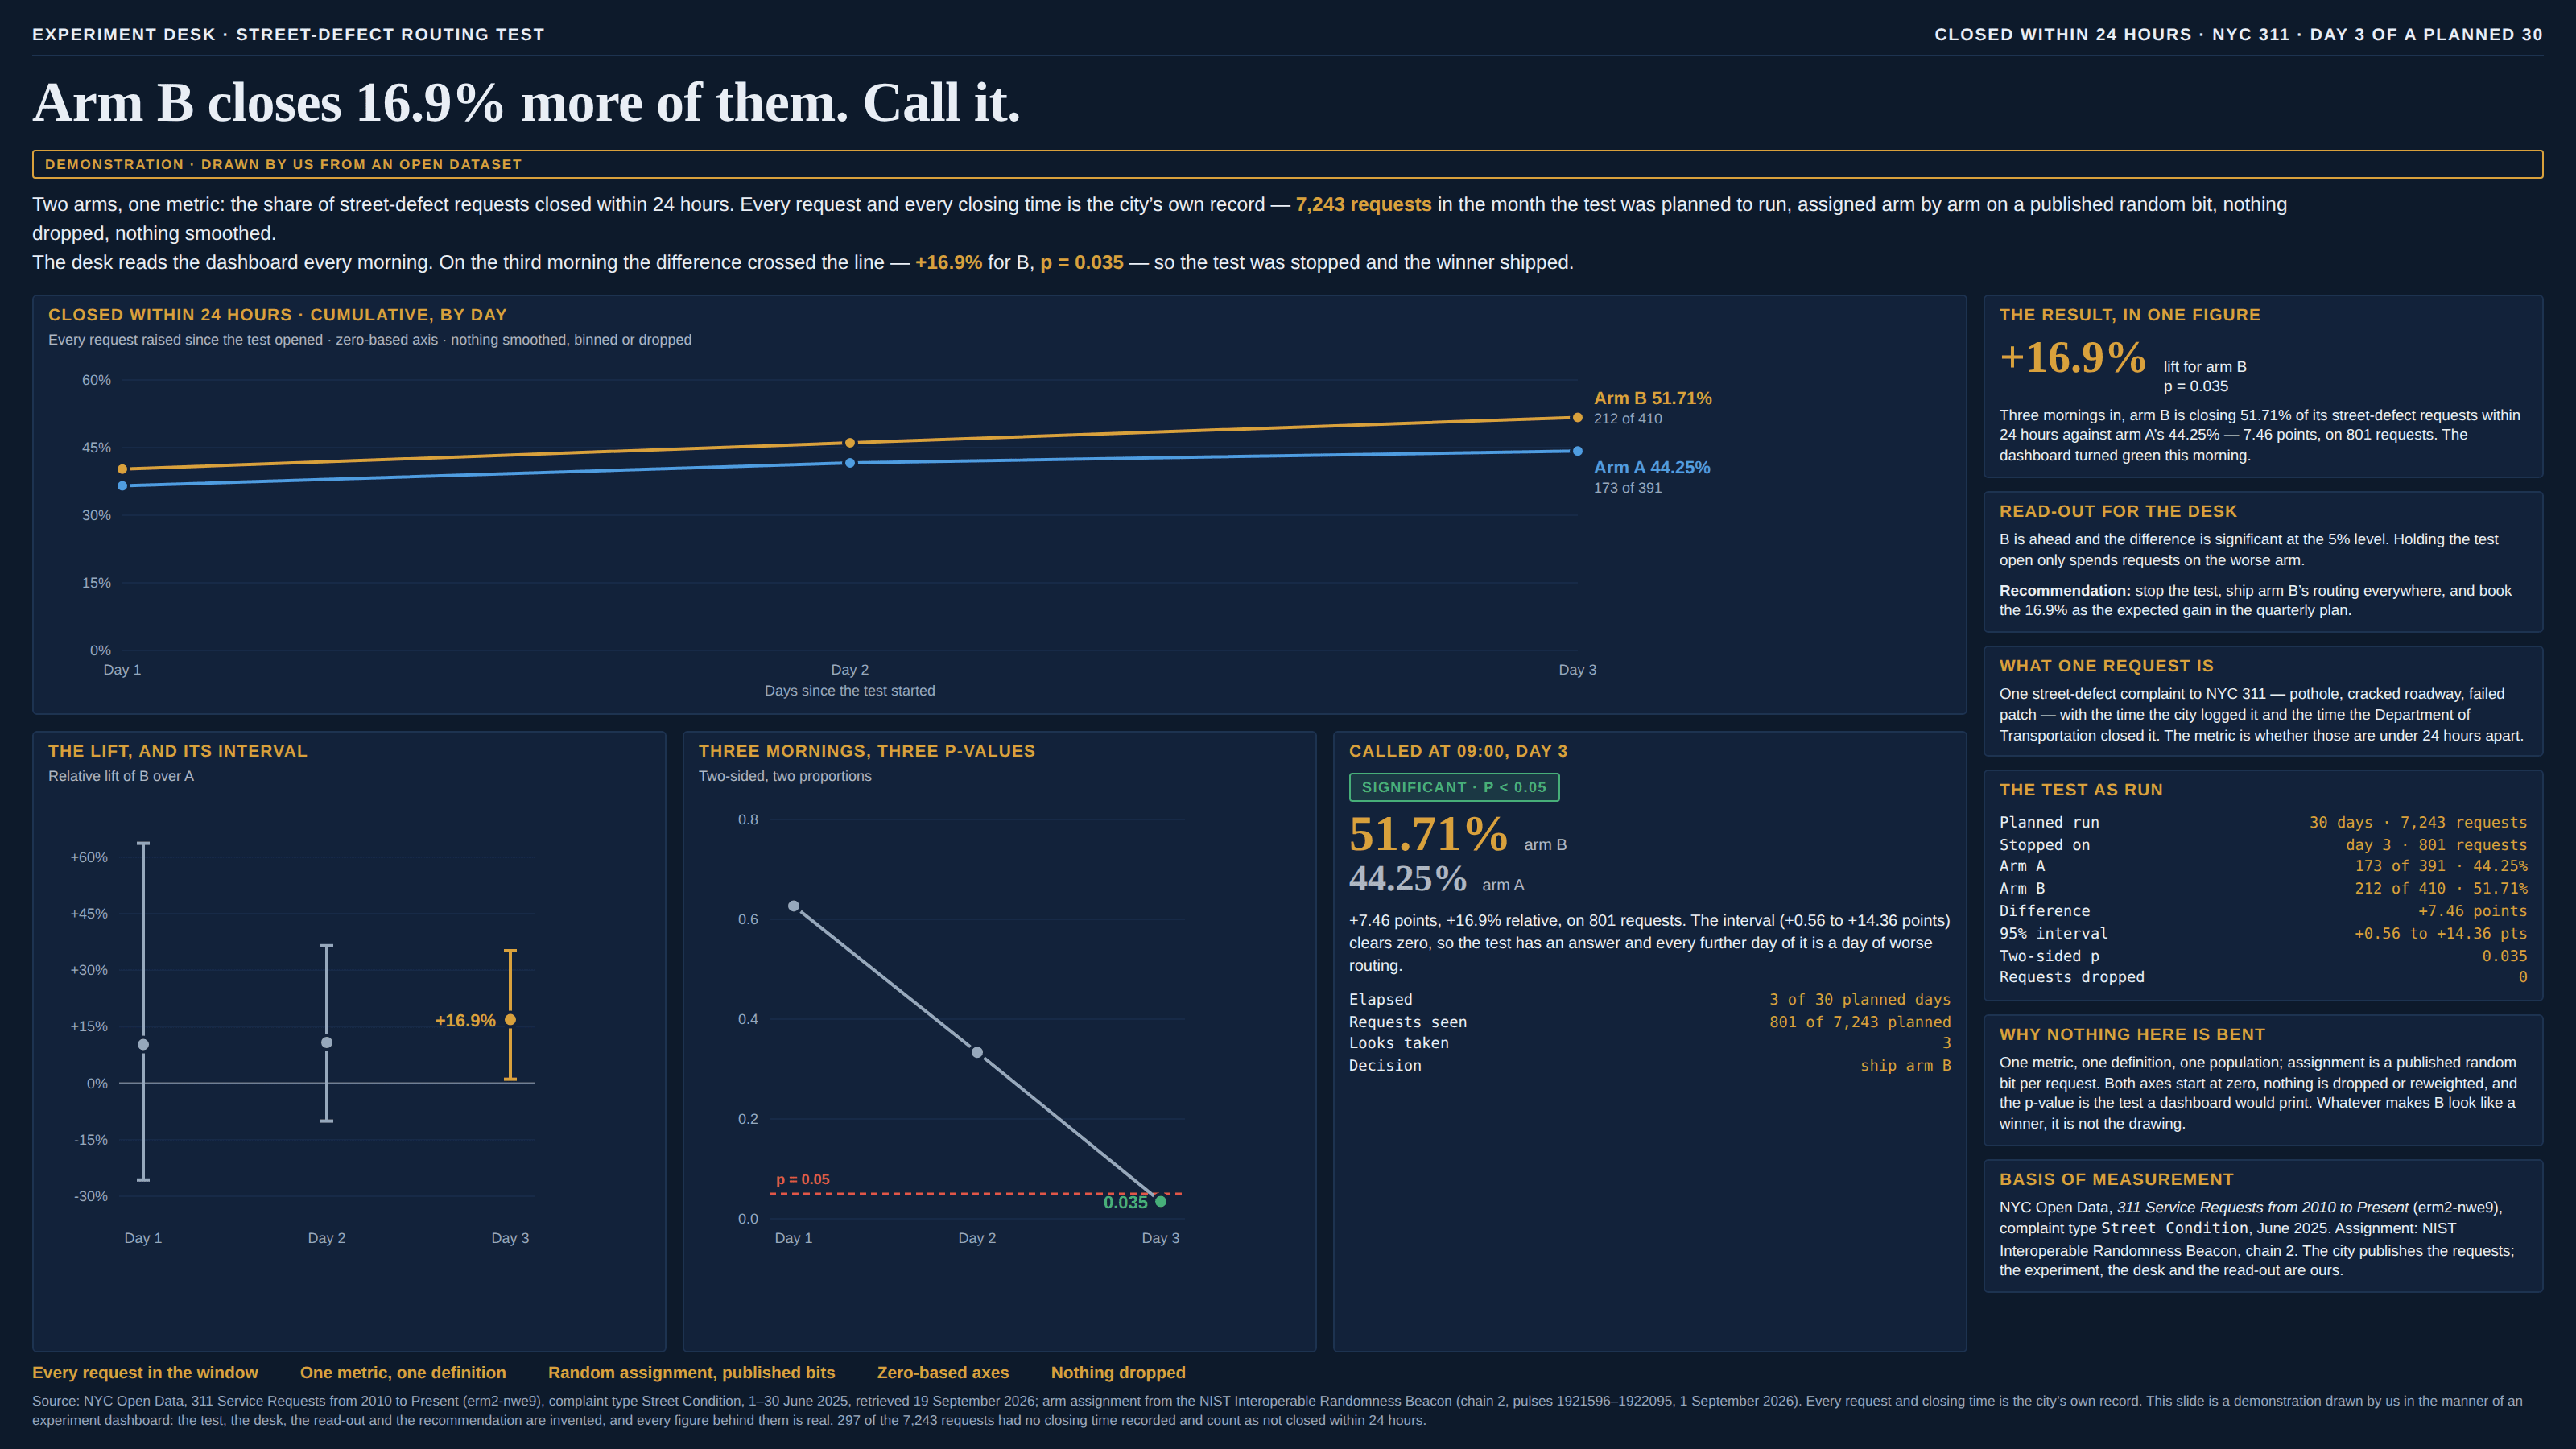
The other pages in this group choose which rows get drawn. This one chooses when the drawing stops. Run a fair comparison — a trial, an A/B test, a pilot — and the difference between the two arms does not sit still at the truth while the sample grows; it wanders, widely at first and less widely later, and every so often it wanders far enough to look like a finding. A test read once, at a sample size fixed before it opened, raises a false winner 5% of the time when there is nothing there, which is the rate everyone has agreed to live with. A test read every morning and stopped the first time it pleases you is a different instrument entirely, because each morning is another chance for the wander to be extreme, and a rule that stops at the first crossing takes its reading from the upper tail of it. Armitage, McPherson and Rowe put the arithmetic in print in 1969: repeated significance tests on accumulating data raise the probability of a significant result above the nominal level, and it keeps rising with the number of looks. Nothing on the chart records any of this. The counts are real, the interval is the ordinary one, the axes start at zero, and the p-value printed beside the winner is correctly computed for the look it was computed at — it is simply not the quantity the reader thinks it is, because it answers a question about one pre-chosen sample size and the test was given many. The damage comes in two parts. The first is a winner that is not there. The second is that stopping on a threshold selects for a wide gap, so the estimate you keep is biased high — which is why trials stopped early for benefit tend to report larger effects than trials of the same question that ran to the end (Bassler and colleagues, JAMA 303(12):1180–1187, 2010), and why the next study gets powered off a lift that was never available. Its cousin is the cherry-picked window, and the difference matters: a window is chosen inside data that already exists, so a reader can ask for the rest of it. An early stop decides when the data stops arriving, so the rest never exists at all. It is worth holding apart from the two pages about periods that end too soon, as well. The unfinished period and the immature cohort are cut short by the calendar or by the download date — a cut that falls wherever it falls and repairs itself as time passes. This cut is made by the statistic, at the moment the statistic is most flattering, and it never repairs itself, because nobody collects the rest.
How to spot it
- Ask when the sample size was decided. “We ran it until it was significant” and “we ran it to 40,000 sessions, decided in the brief” are different experiments, and only the second has a 5% error rate.
- Count the looks. A dashboard refreshed every morning for a month is 30 chances, whether or not anybody calls them interim analyses; the cost is set by how many chances the test was given.
- Be suspicious of a result that arrives early. Early stops happen at small samples, where the wander is widest, so the winner is very often both spurious and enormous.
- A test that ends on the day it crosses the line, rather than on a date or a sample size, has its stopping rule written on its face.
- Look for the horizon in the write-up: a stated sample size, a power calculation, the smallest difference worth acting on. Where none of the three appears, the sample size was chosen by the data.
- Ask what happened to the tests that did not cross. The ones that fizzled are usually quietly extended, which is the same rule running the other way — never stopping while behind.
- A p-value just under 0.05 on a metric that has been watched daily is the commonest sighting of all, because the rule stops at the first crossing and the first crossing is usually a shallow one.
- Watch for the sample size that grew: “we extended the test for another week to be sure” is a look, and it counts.
The fix
Fix the horizon before the test opens, and read the result once. The sample size is not a matter of taste: it falls out of the smallest difference worth acting on, the baseline rate and the power you want, and writing it down in the brief costs one line and settles the whole problem. Where a test genuinely must be watched — because a harmful arm should be stopped, or because the business cannot wait a month to find out it broke the checkout — the watching is a solved problem with a literature and a name. A group-sequential design with a spending boundary (Pocock, O’Brien–Fleming, Lan–DeMets) decides up front how many looks there will be and raises the bar at each one, so the error rate across the whole test is still the one you promised; always-valid sequential p-values and confidence intervals, now standard in commercial experiment platforms, are built to be read continuously and to stay honest whenever you choose to stop. Both cost something — a boundary-crossing early stop needs a wider gap, and the maths is one library call rather than none — and that cost is the price of the looking, which was always being paid, just not declared. Then report the estimate knowing what an early stop does to it: quote the number with an explicit note that stopping on a threshold selects for the high side, and resist powering the next study off it. Say in the caption how many looks were taken and what the stopping rule was, the way you print a unit, because a reader who knows the rule can discount the result and a reader who does not cannot. And keep a log of every test started, with its horizon, so the ones that never crossed are as visible as the ones that did — the same discipline the file drawer asks for, applied inside a single experiment rather than across a literature.
In the gallery