All techniques
Framing & context
Simpson’s paradox
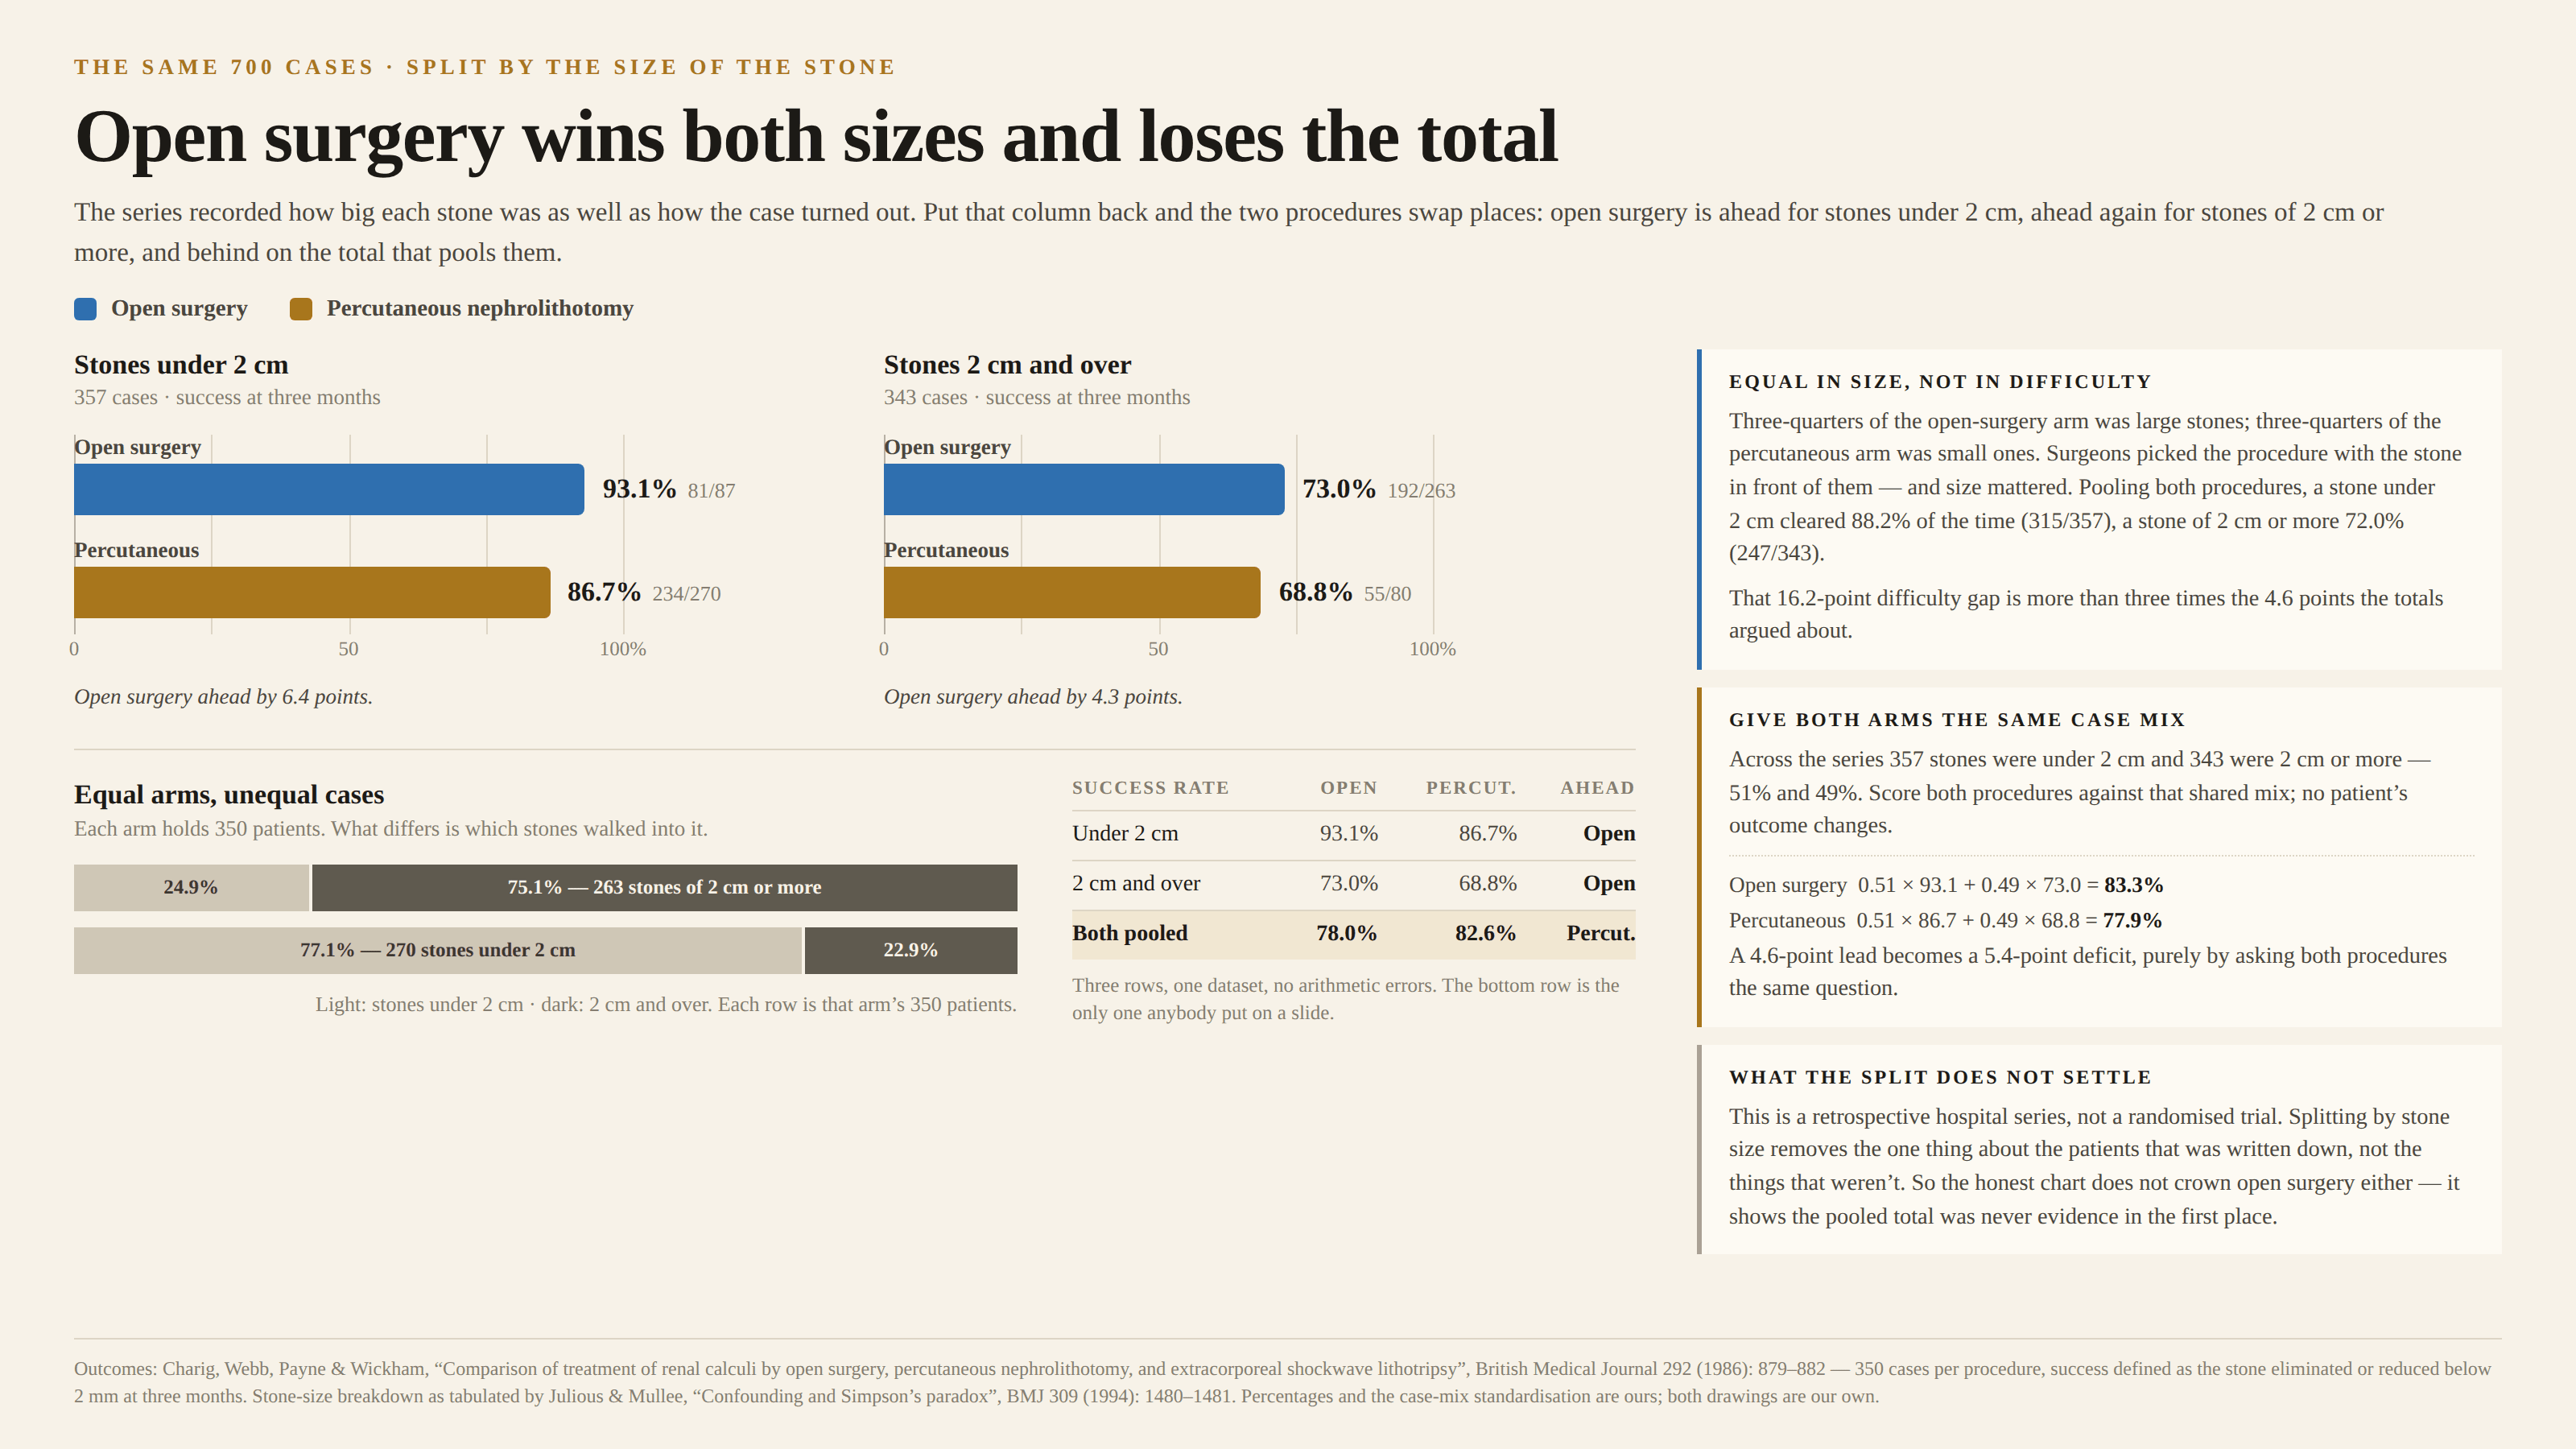
Every group goes one way. The total goes the other.
a.k.a. the reversal paradox · the Yule–Simpson effect · aggregation bias · confounded totals
Break a comparison into groups and each group can point one way while the pooled total points the other, with no arithmetic error anywhere. It happens when the two sides being compared are not made of the same mix of cases: whichever side was handed the easy ones wins the total on case mix alone. The pooled number then mostly records who got which cases, wearing the clothes of a result.
How to spot it
- One headline rate per side, where each side chose its own members.
- Equal sample sizes offered as proof that nothing needs adjusting — equal n says nothing about equal difficulty.
- Ask what varies inside each side that also drives the outcome, then ask whether it is split evenly between them.
- A gap that shrinks, vanishes, or reverses depending on which breakdown happens to be on the slide.
The fix
Break the comparison out by the thing that drives the outcome and show every group, not just the total. If a single number is needed, standardise it — score both sides against one shared mix of cases, so they are being asked the same question. And when the mix was chosen rather than assigned, say what the number can and cannot settle: undoing the confounder you happened to record is not the same as undoing the ones you didn’t.
In the gallery