All techniques
Size & scale
The stack with one baseline
One band starts at zero. The rest float on whatever is underneath them.
a.k.a. stacked area chart · stacked bars · the 100% stack · share-of-total chart · the floating band · composition chart
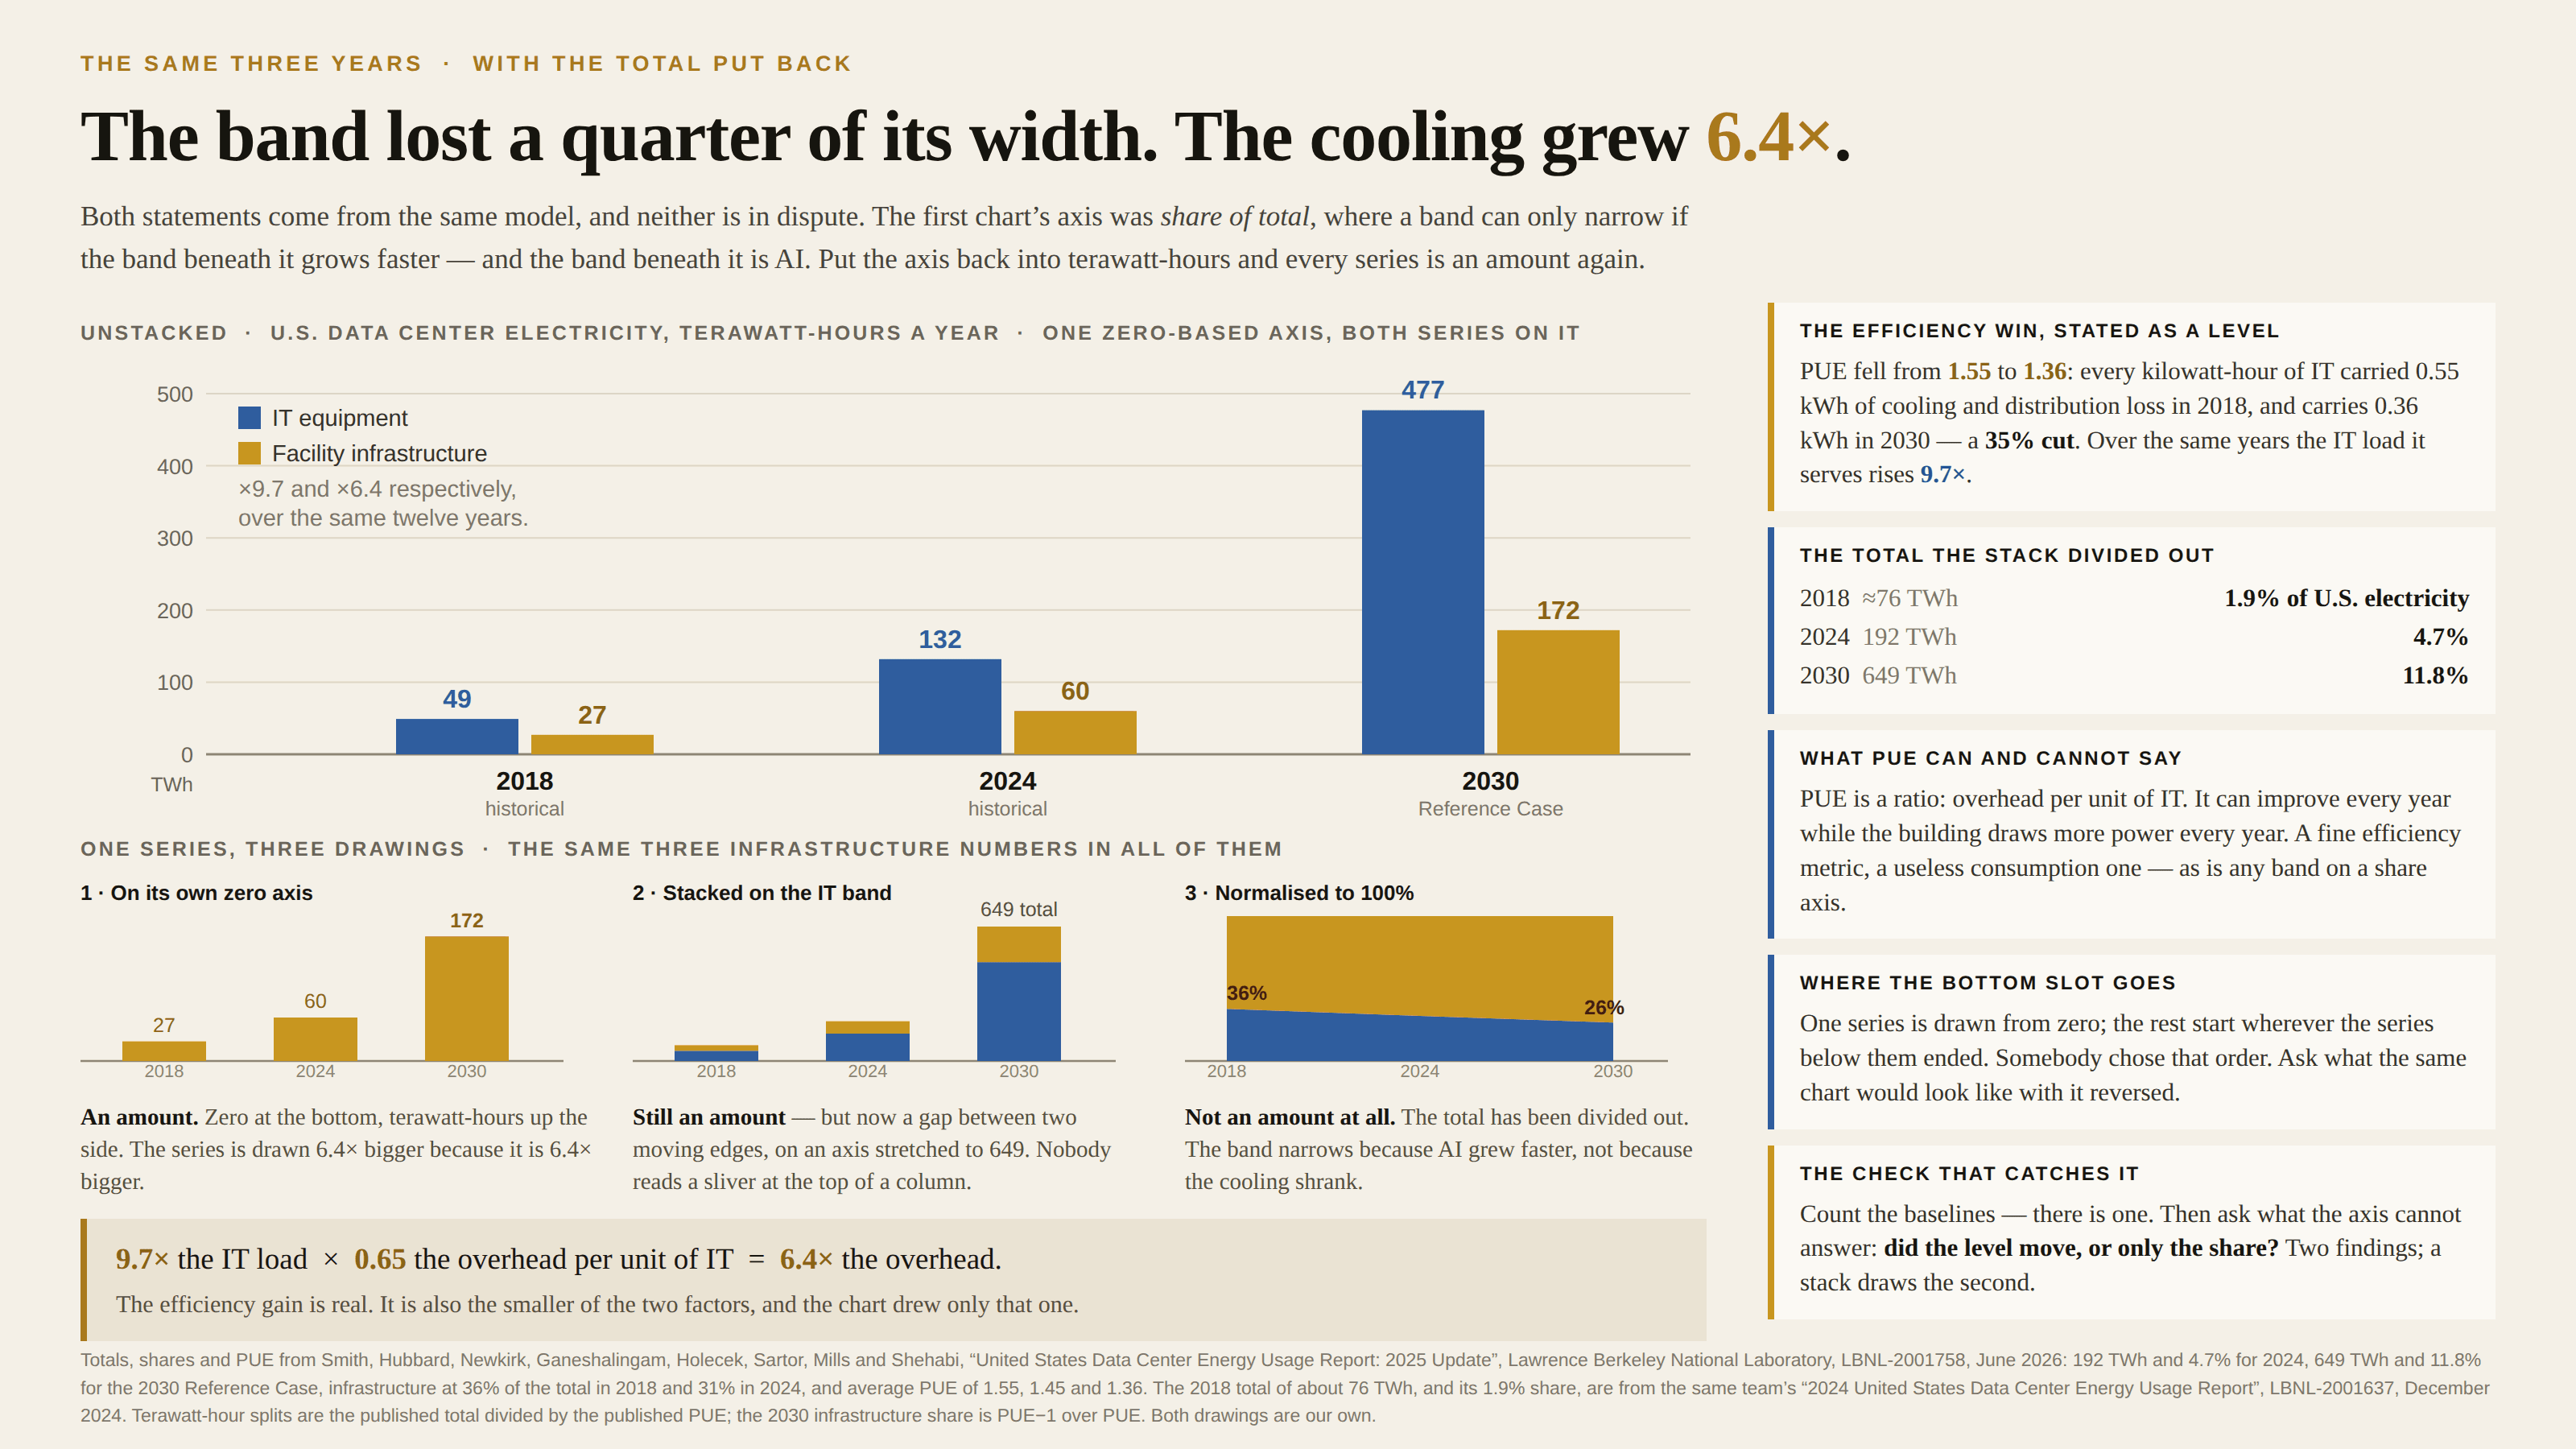
Stacking pours the series into one silhouette, and only the one at the bottom keeps a baseline. Every band above it is the gap between two moving edges, so reading one means subtracting two positions the chart never prints — and where the stack climbs steeply the eye measures the shortest way across the band rather than the vertical way, which shaves it thinner still. Then there is the variant that runs the axis to 100%, and it is the one that does real damage: the total is divided out, so nothing on the page is an amount any more. A series that tripled can only be drawn as a narrowing band if the series beneath it grew faster, and narrowing is what the reader remembers.
How to spot it
- Count the baselines. There is one, at the bottom. Every other band’s zero is wherever the band below it happened to end.
- Pick a band that isn’t the bottom one and try to read its value at a given year. If it takes a ruler and a subtraction, the chart is not showing you that number.
- Read the axis. If it ends at 100%, no band on it is a quantity, and no band can rise unless another falls.
- A band that “shrinks” while the total grows: check whether it shrank, or merely grew more slowly than the thing underneath it.
- Ask who got the bottom slot. That series is the only one drawn from zero, and somebody chose it.
- On a steep climb, cover the bands below with your hand. The one you were reading is usually fatter than it looked.
The fix
Unstack it. One panel per series, each with its own zero baseline and its own axis in the unit people actually care about — then every series is a length again, and a component that grew is drawn growing. If the total is part of the story, plot the total as its own line alongside the parts rather than asking a silhouette to carry both jobs at once. Keep the stack only where the question genuinely is “how is the whole divided”, put the series you most want read at the bottom, and print the numbers, because a band the reader cannot measure is a band the reader will guess at. And when a share moves, say in the caption which way the level moved, since those are two different findings and only one of them is on the axis.
In the gallery