All techniques
Framing & context
Strategic binning
The map whose color breaks were drawn after the data arrived.
a.k.a. gerrymandered color scale · class-break shopping
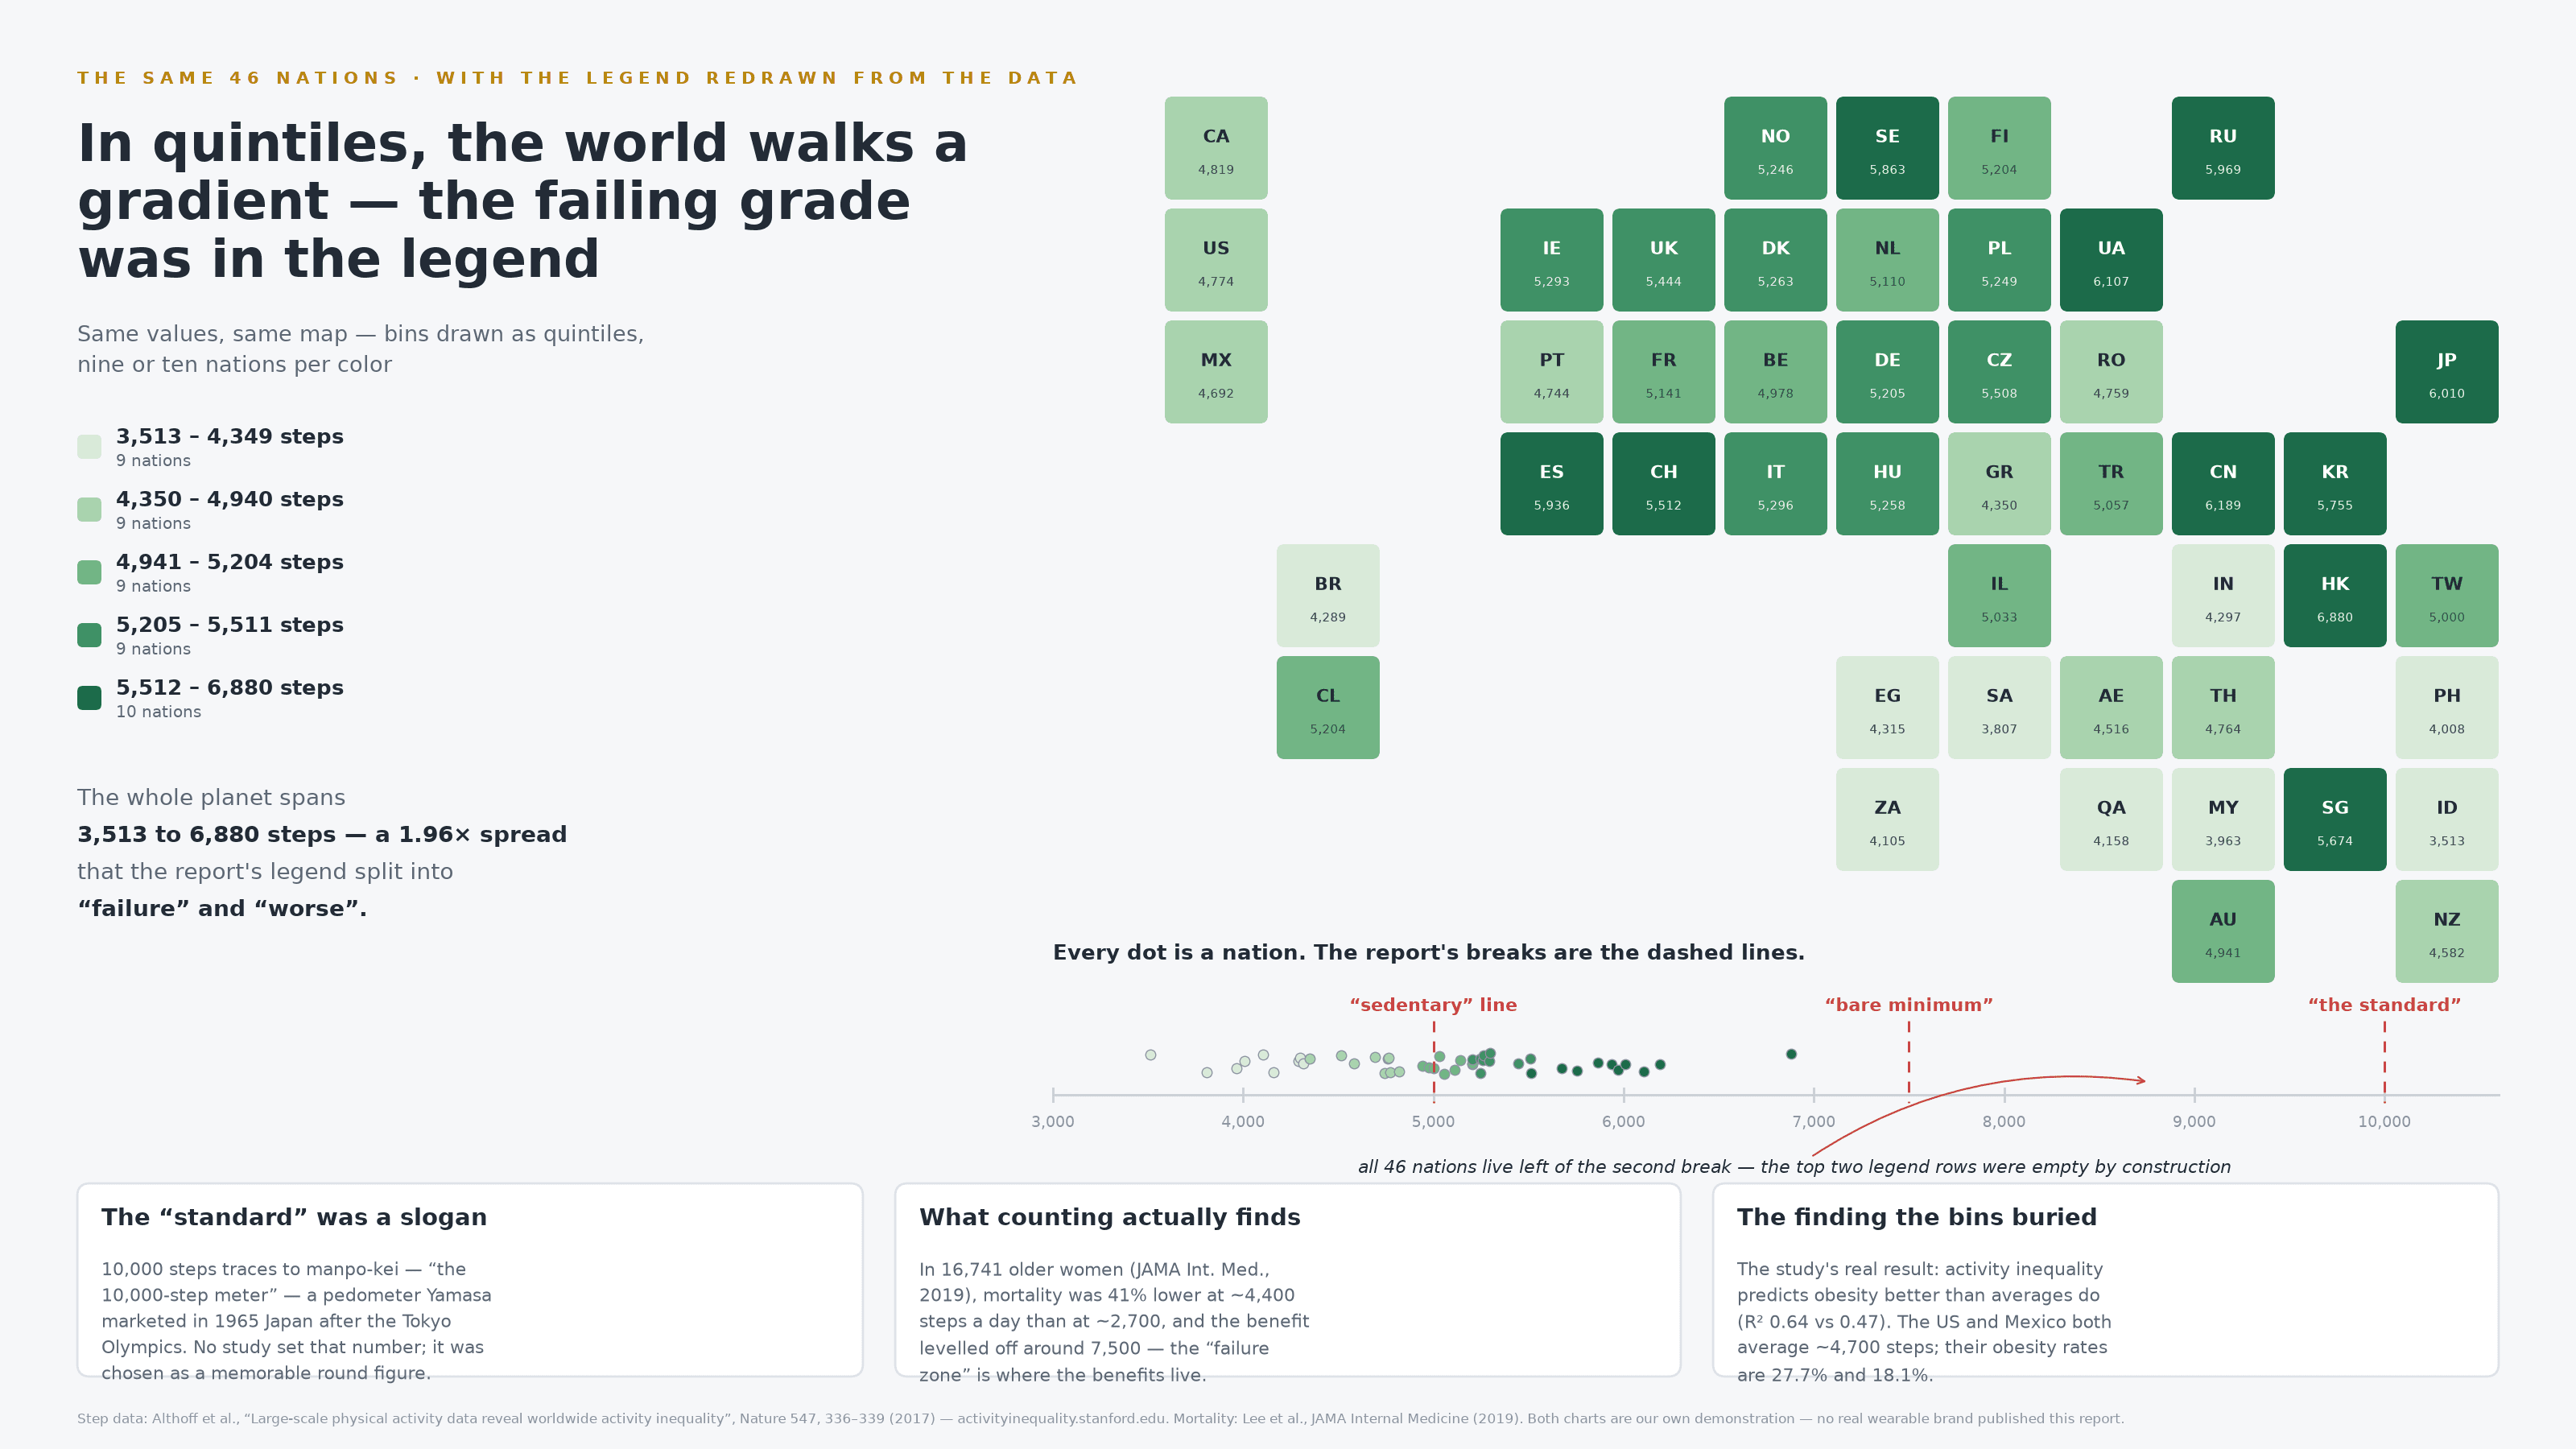
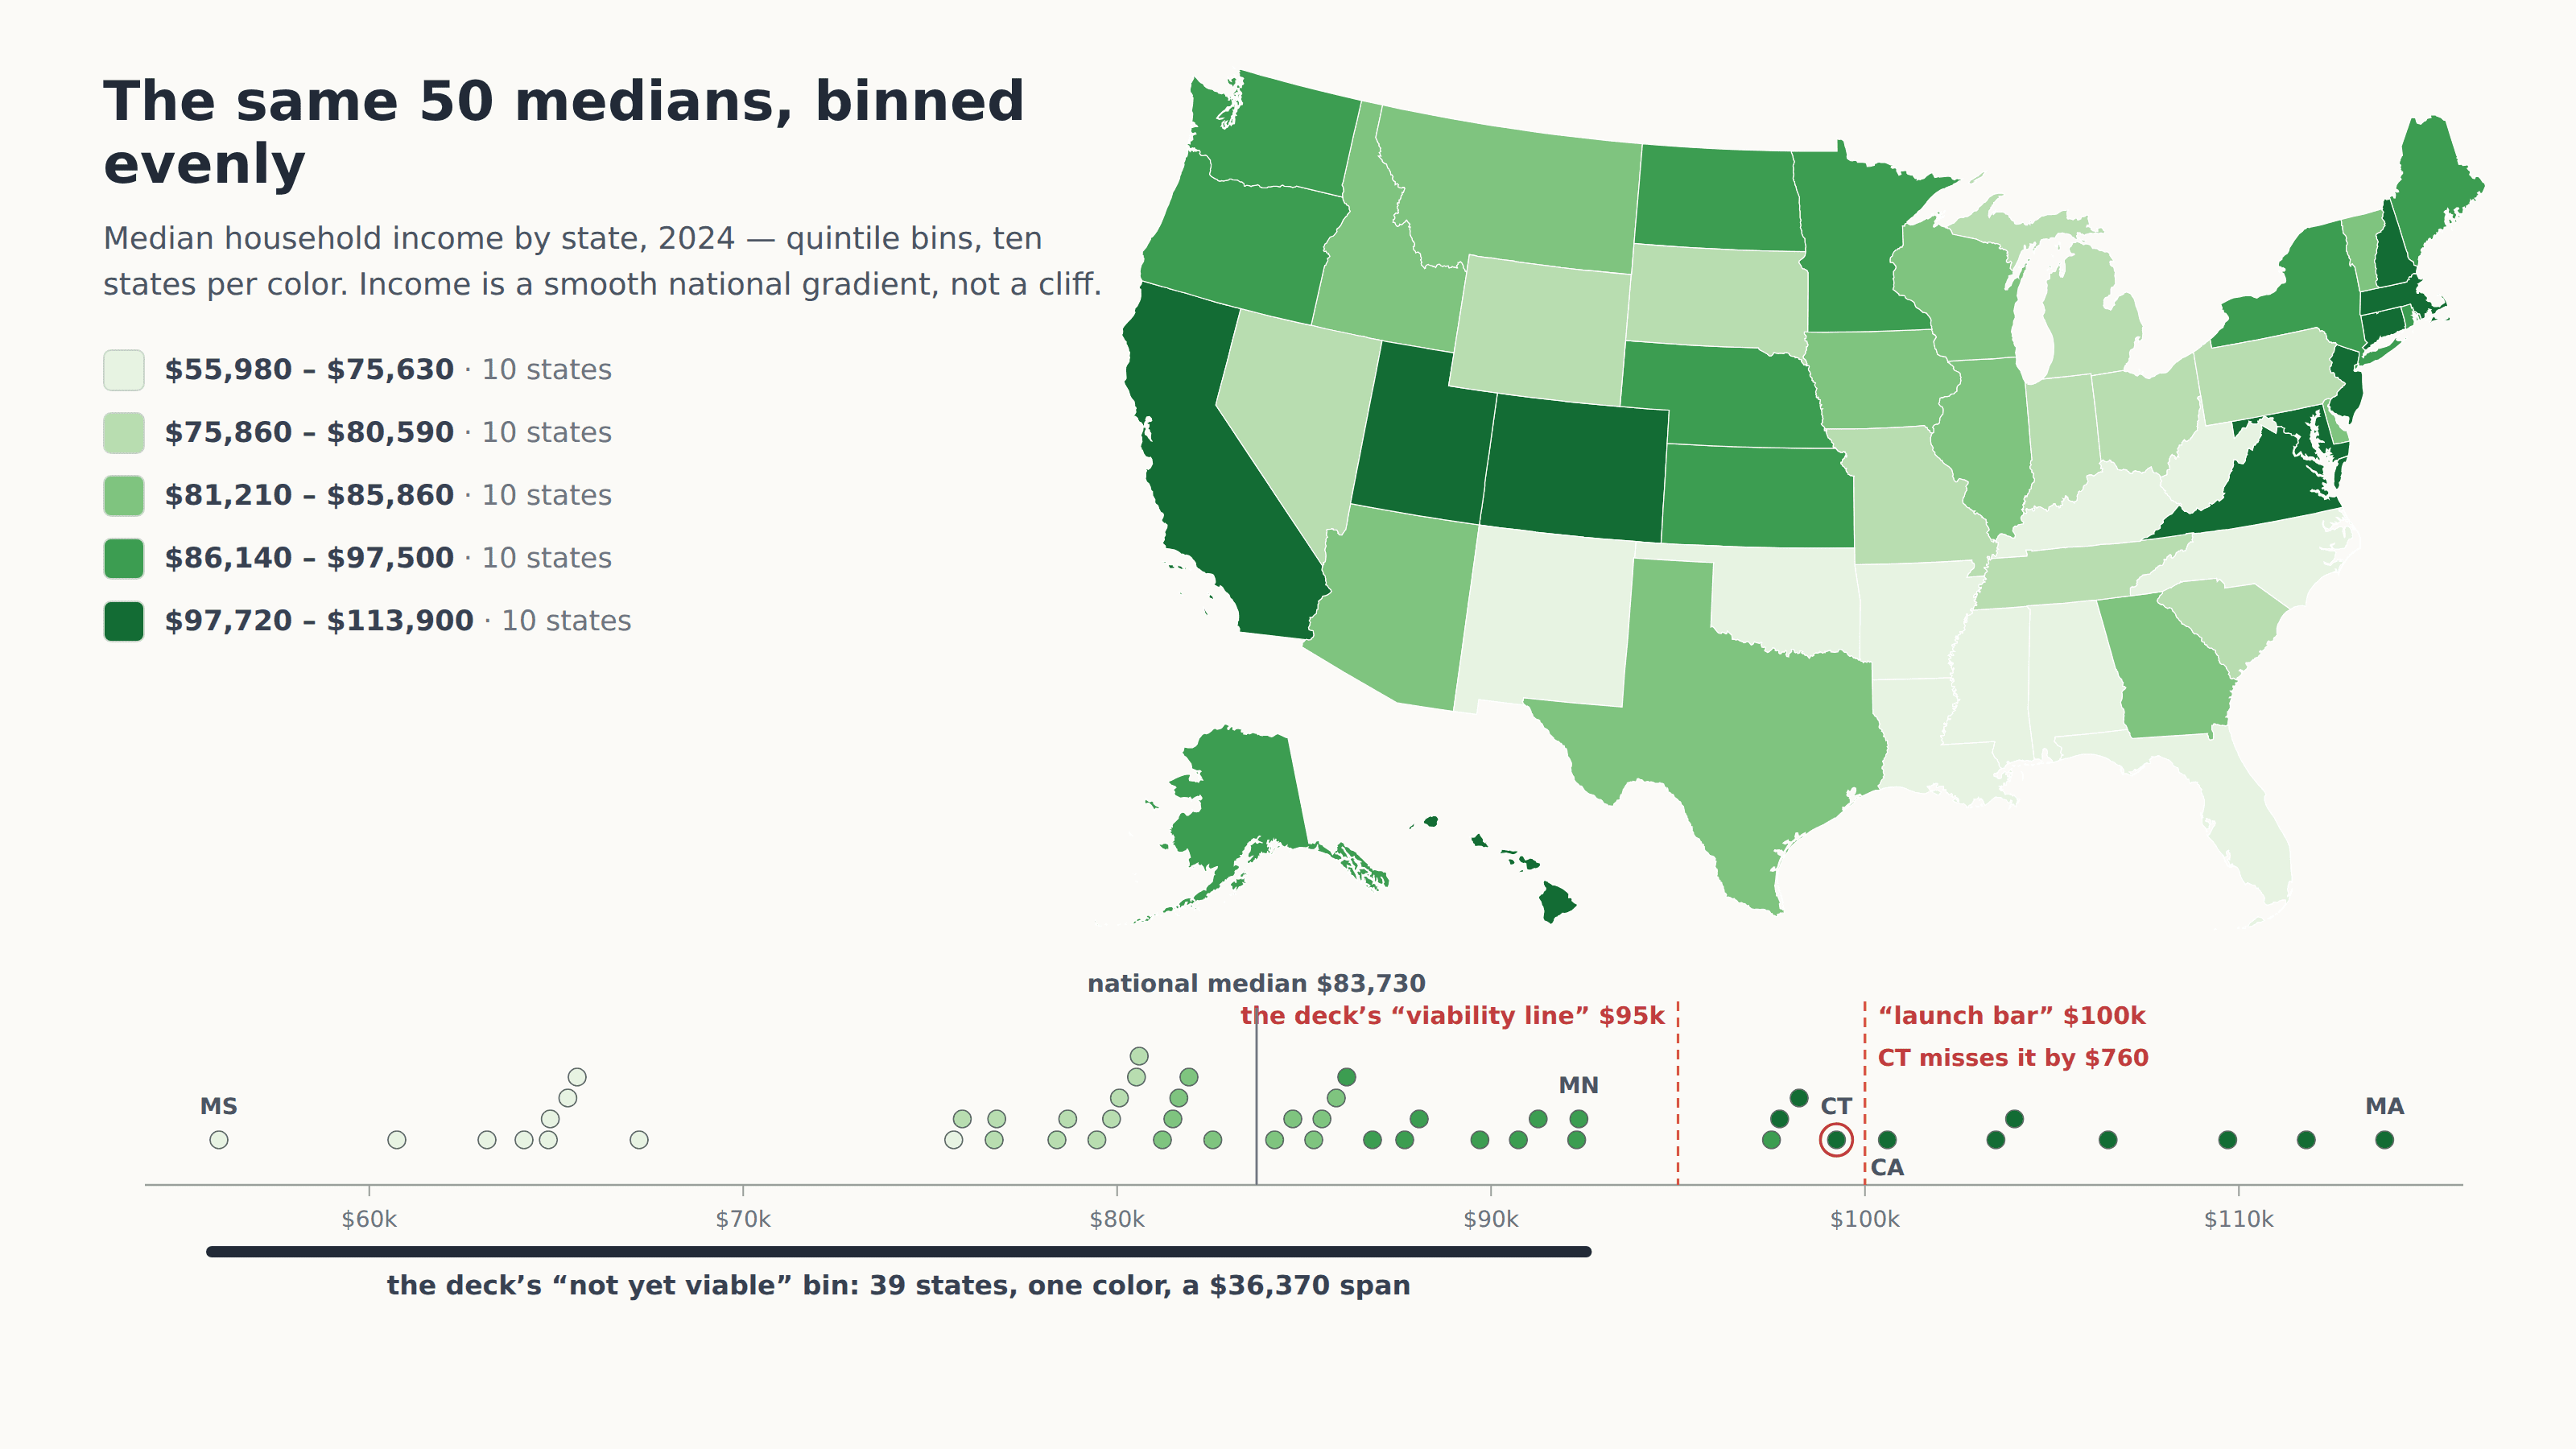
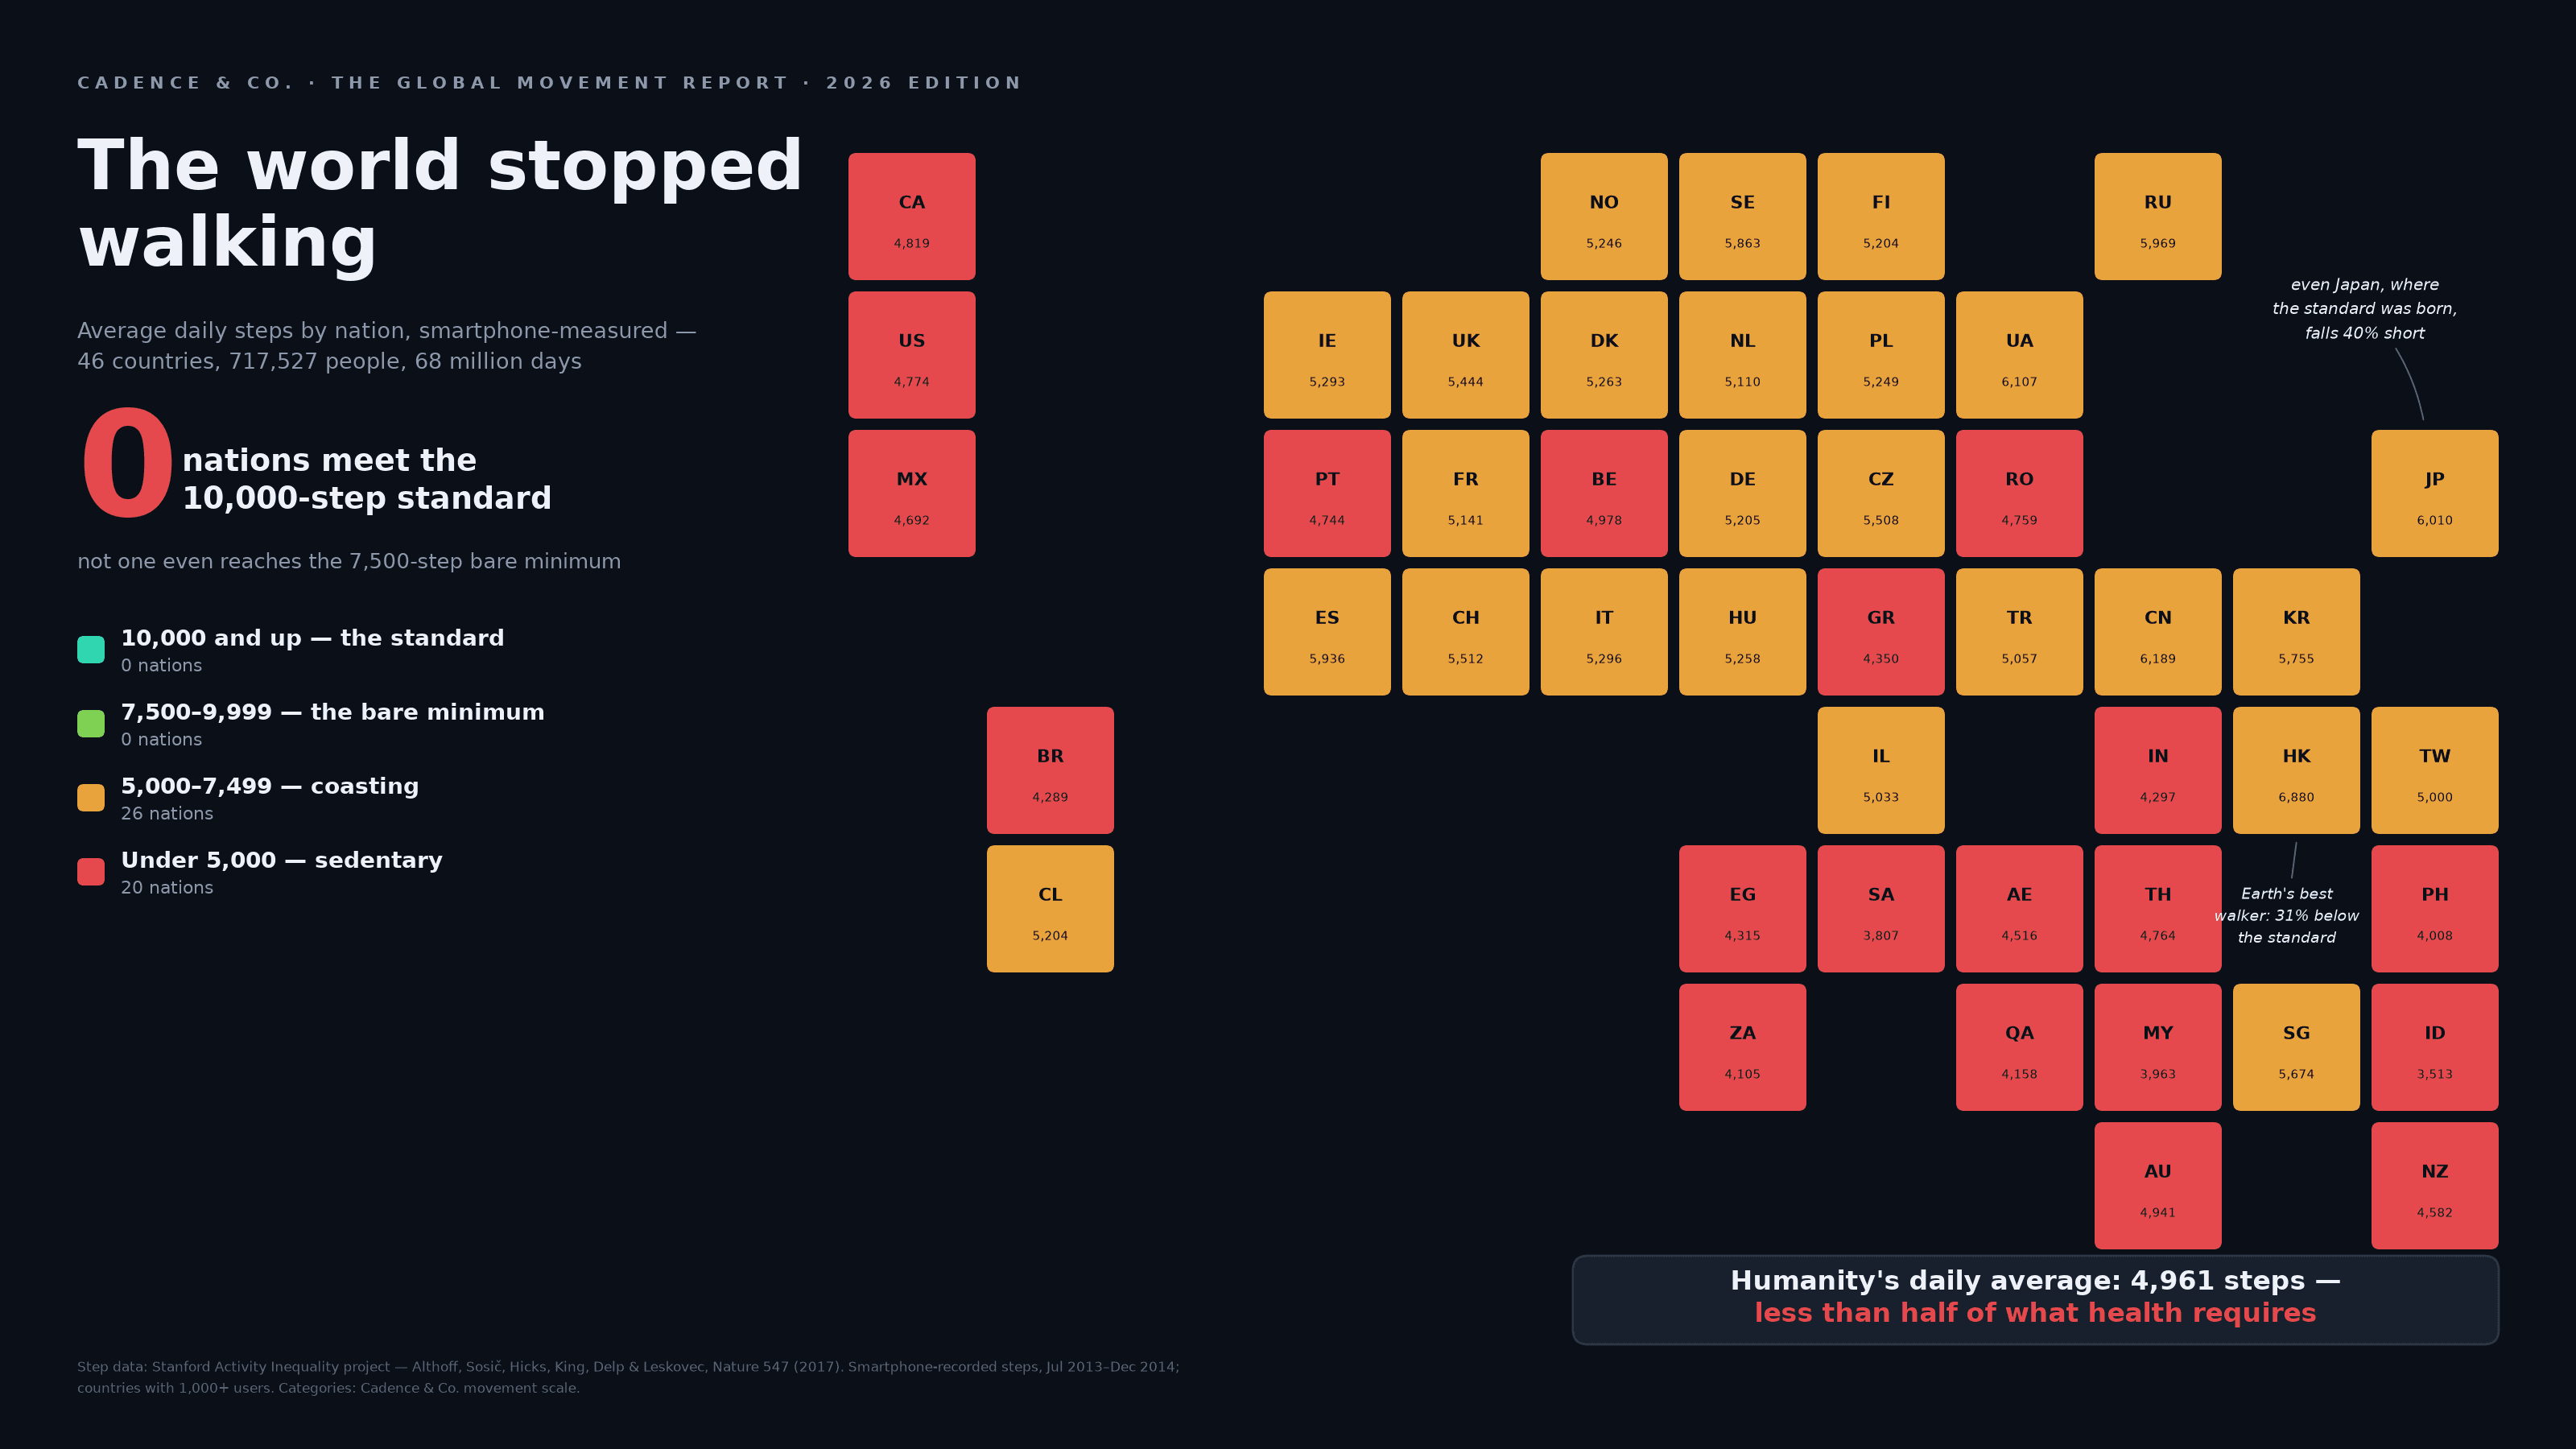
A choropleth’s story lives in its color breaks. Set the bins at 0–10, 10–12, and 12–90 and you can paint the country any shade of crisis you like. Continuous data, discrete lies.
How to spot it
- Bin edges that are weirdly irregular.
- One bin covering a huge range while others cover slivers.
- A diverging color scheme centered on a convenient midpoint.
The fix
Use principled breaks — equal intervals, quantiles — and show the legend’s arithmetic proudly.