All techniques
Cherry-picking
Survivorship bias
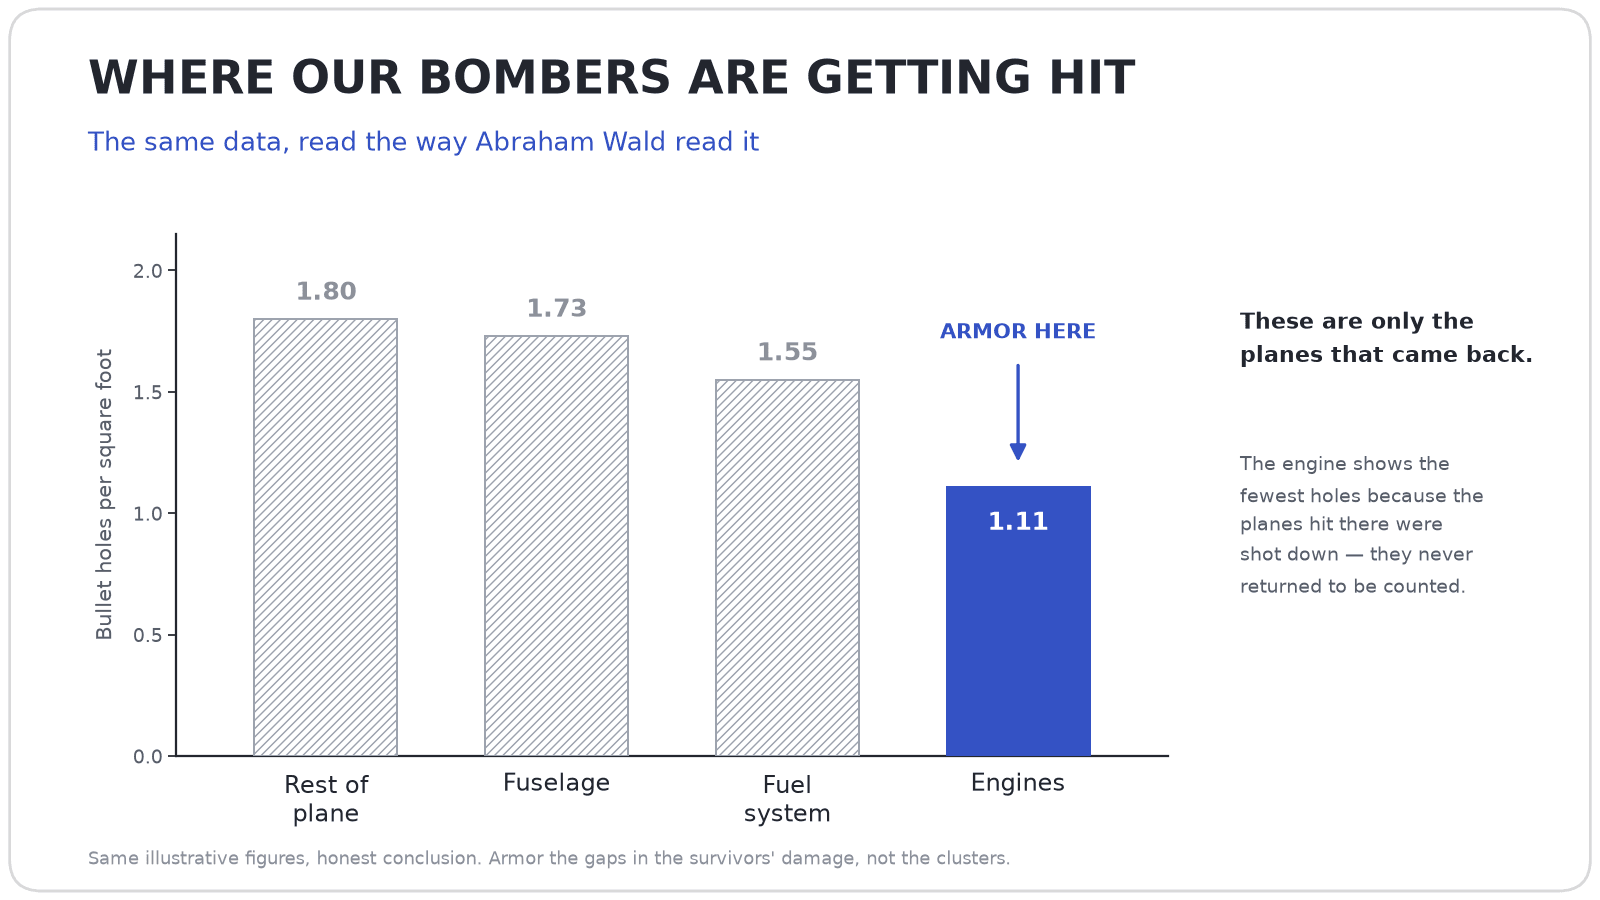
Plotting only the planes that made it home.
a.k.a. the missing dead
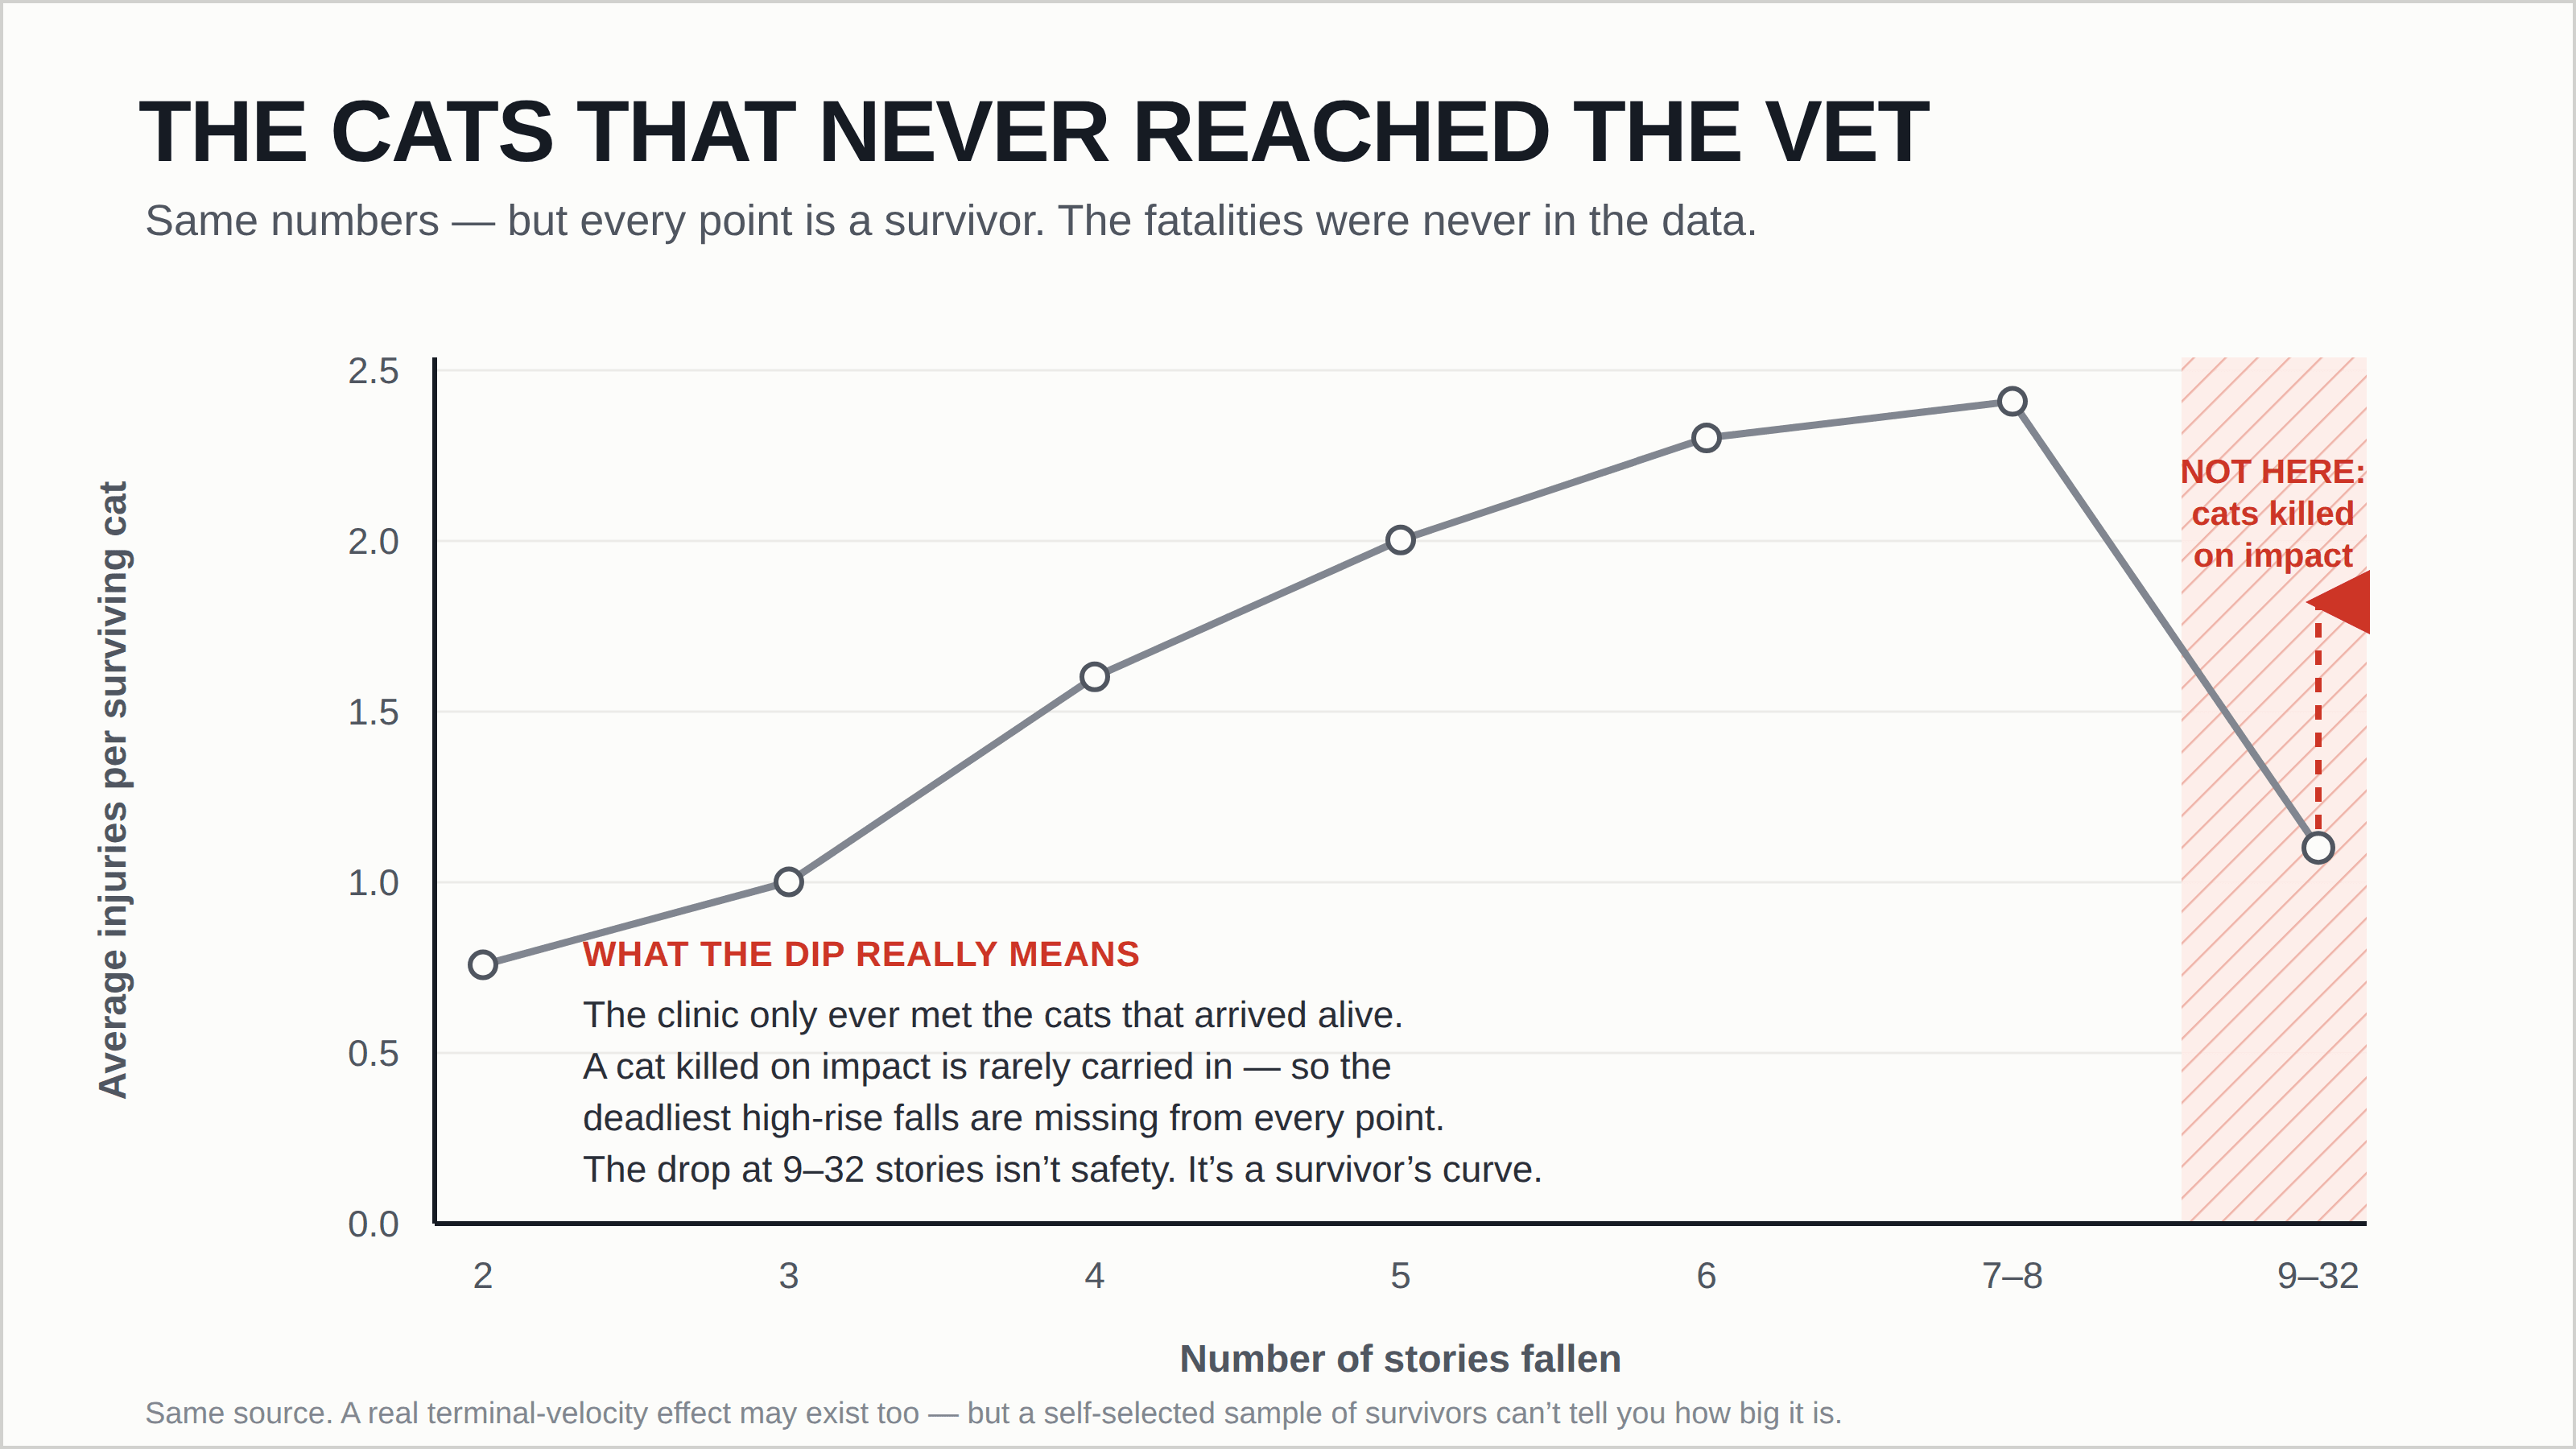
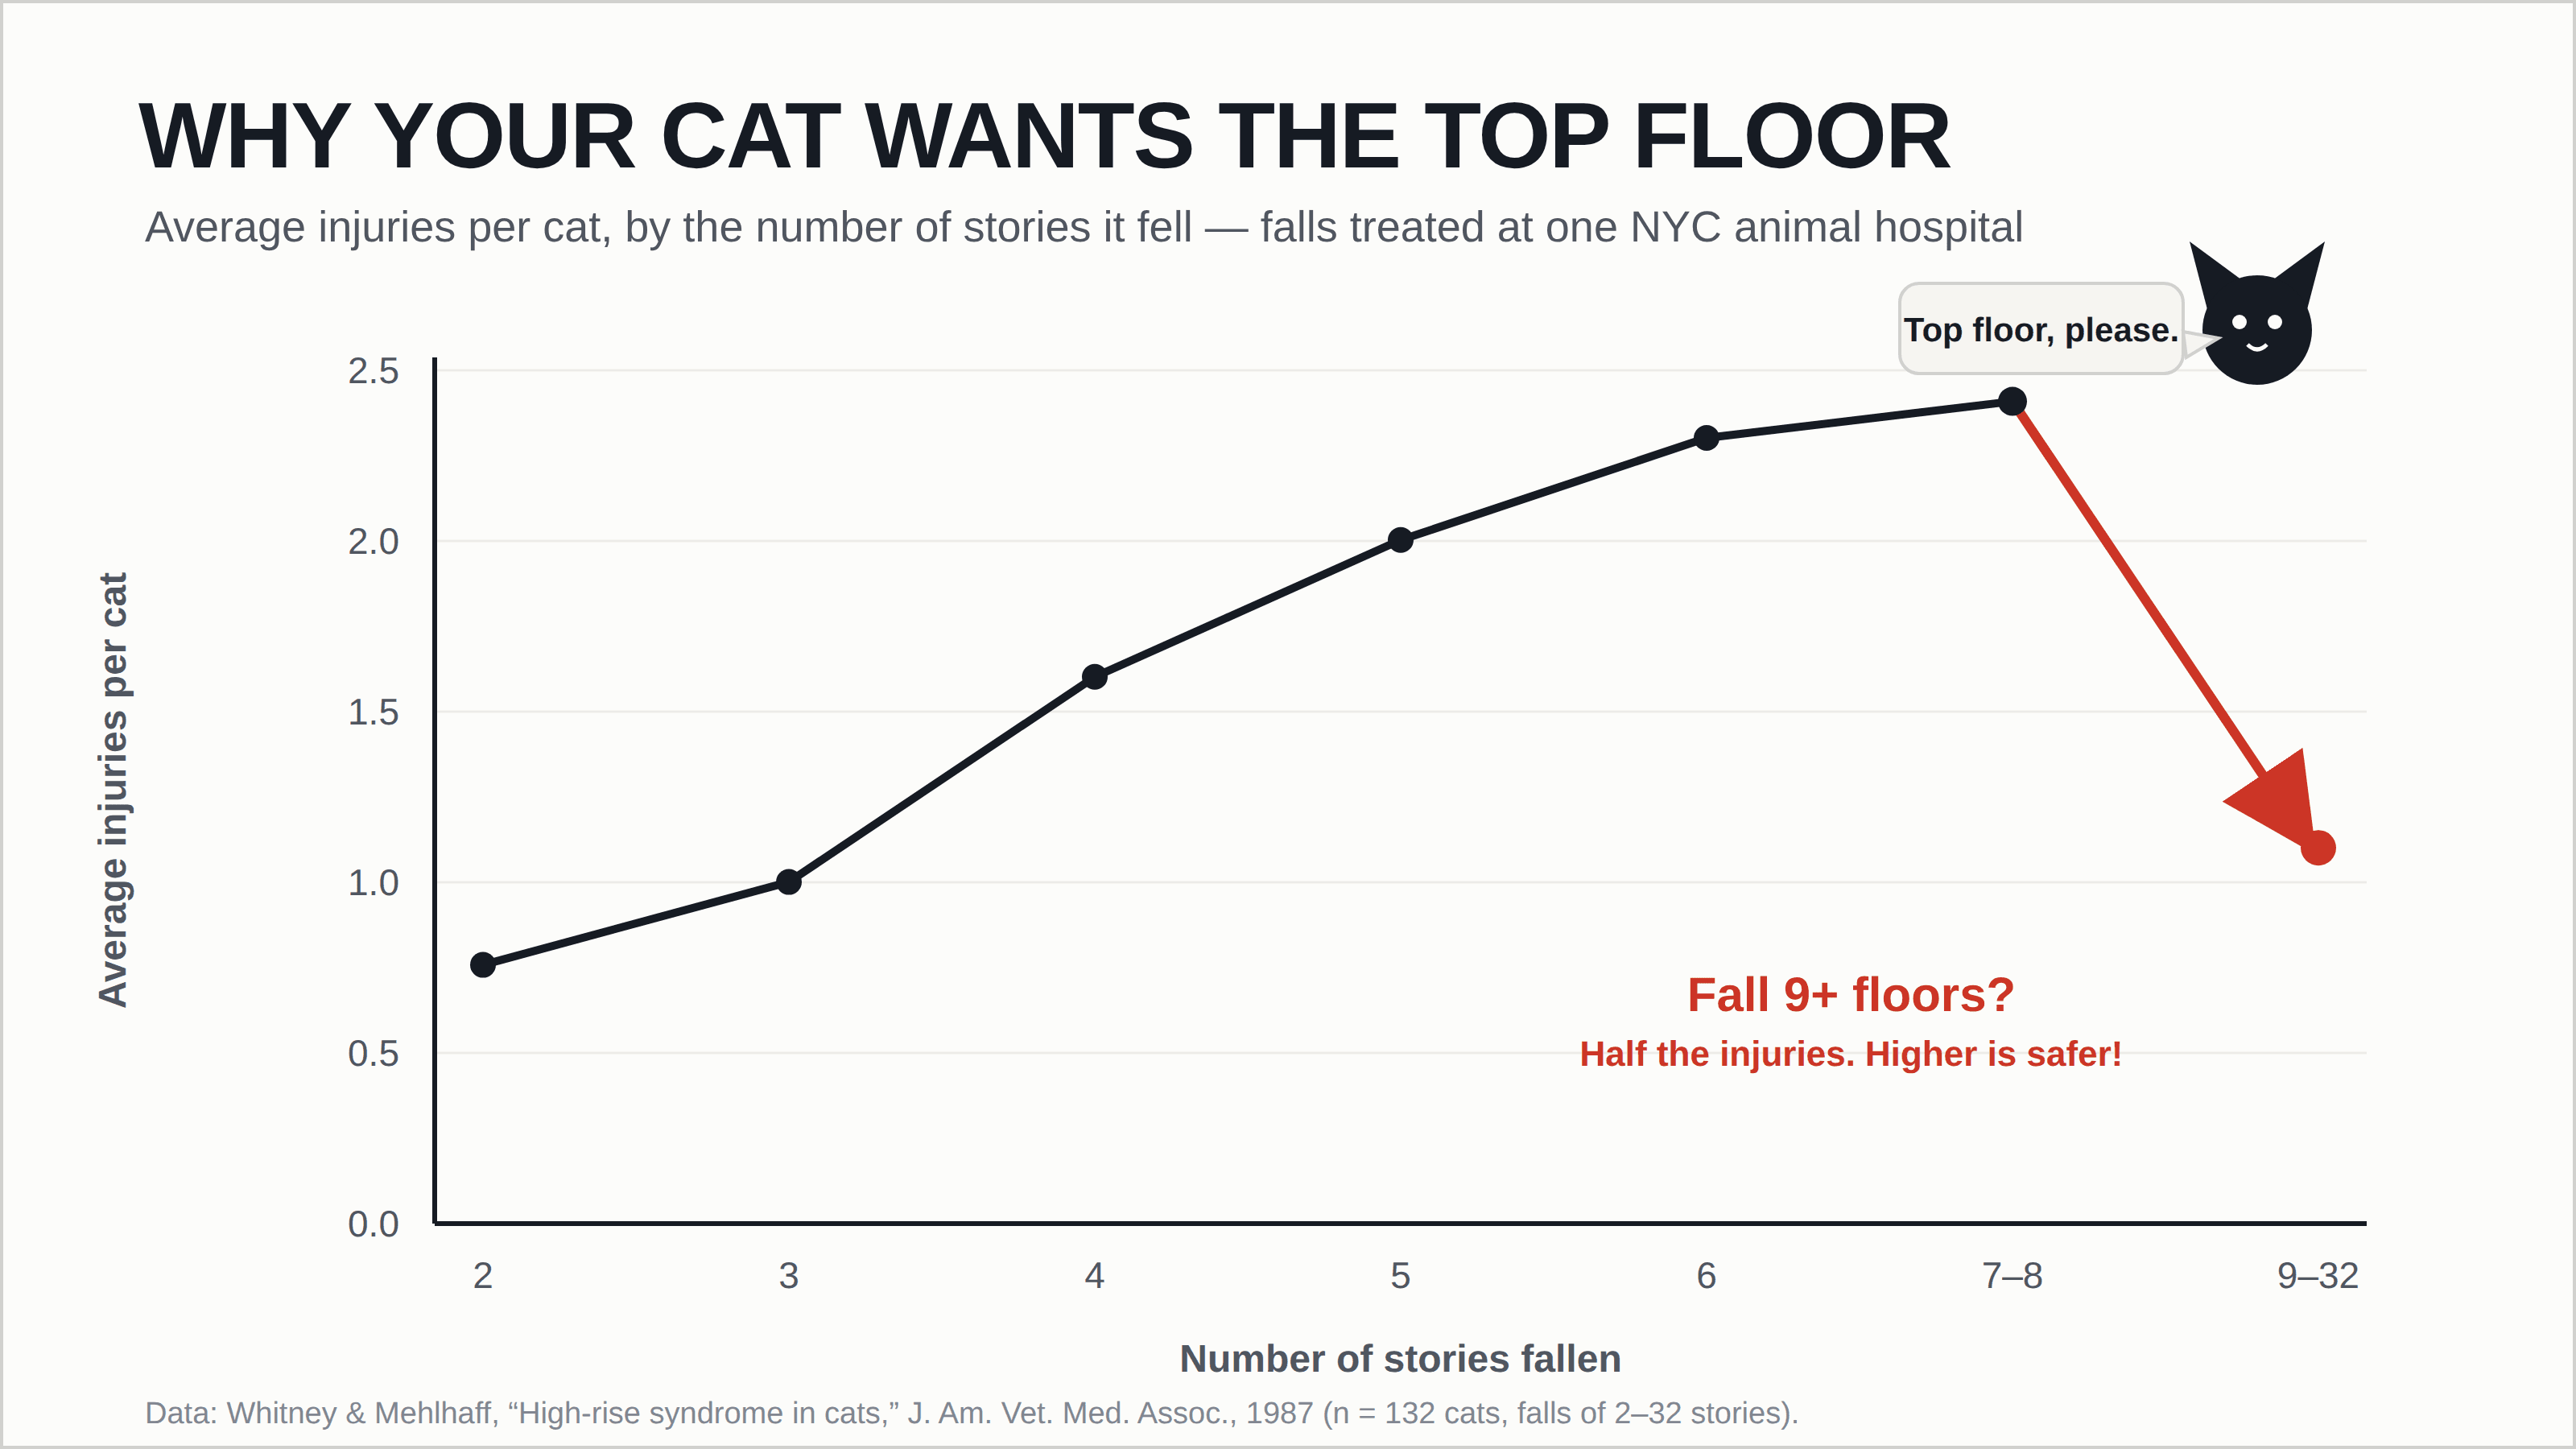
If the dataset only contains winners — funds that still exist, companies that went public, planes that returned — every trend tilts rosy. The bullet holes you can see are the ones that didn’t matter.
How to spot it
- Ask what something had to survive to end up in the dataset.
- Suspiciously smooth success curves for risky endeavors.
The fix
Include the drop-outs, delistings, and wrecks — or state plainly that you can’t.