All techniques
Size & scale
The template funnel
Every band loses the same width. The numbers don’t get a say.
a.k.a. decorative funnel · stepped funnel · SmartArt funnel · pipeline graphic · even-taper funnel · conversion funnel infographic
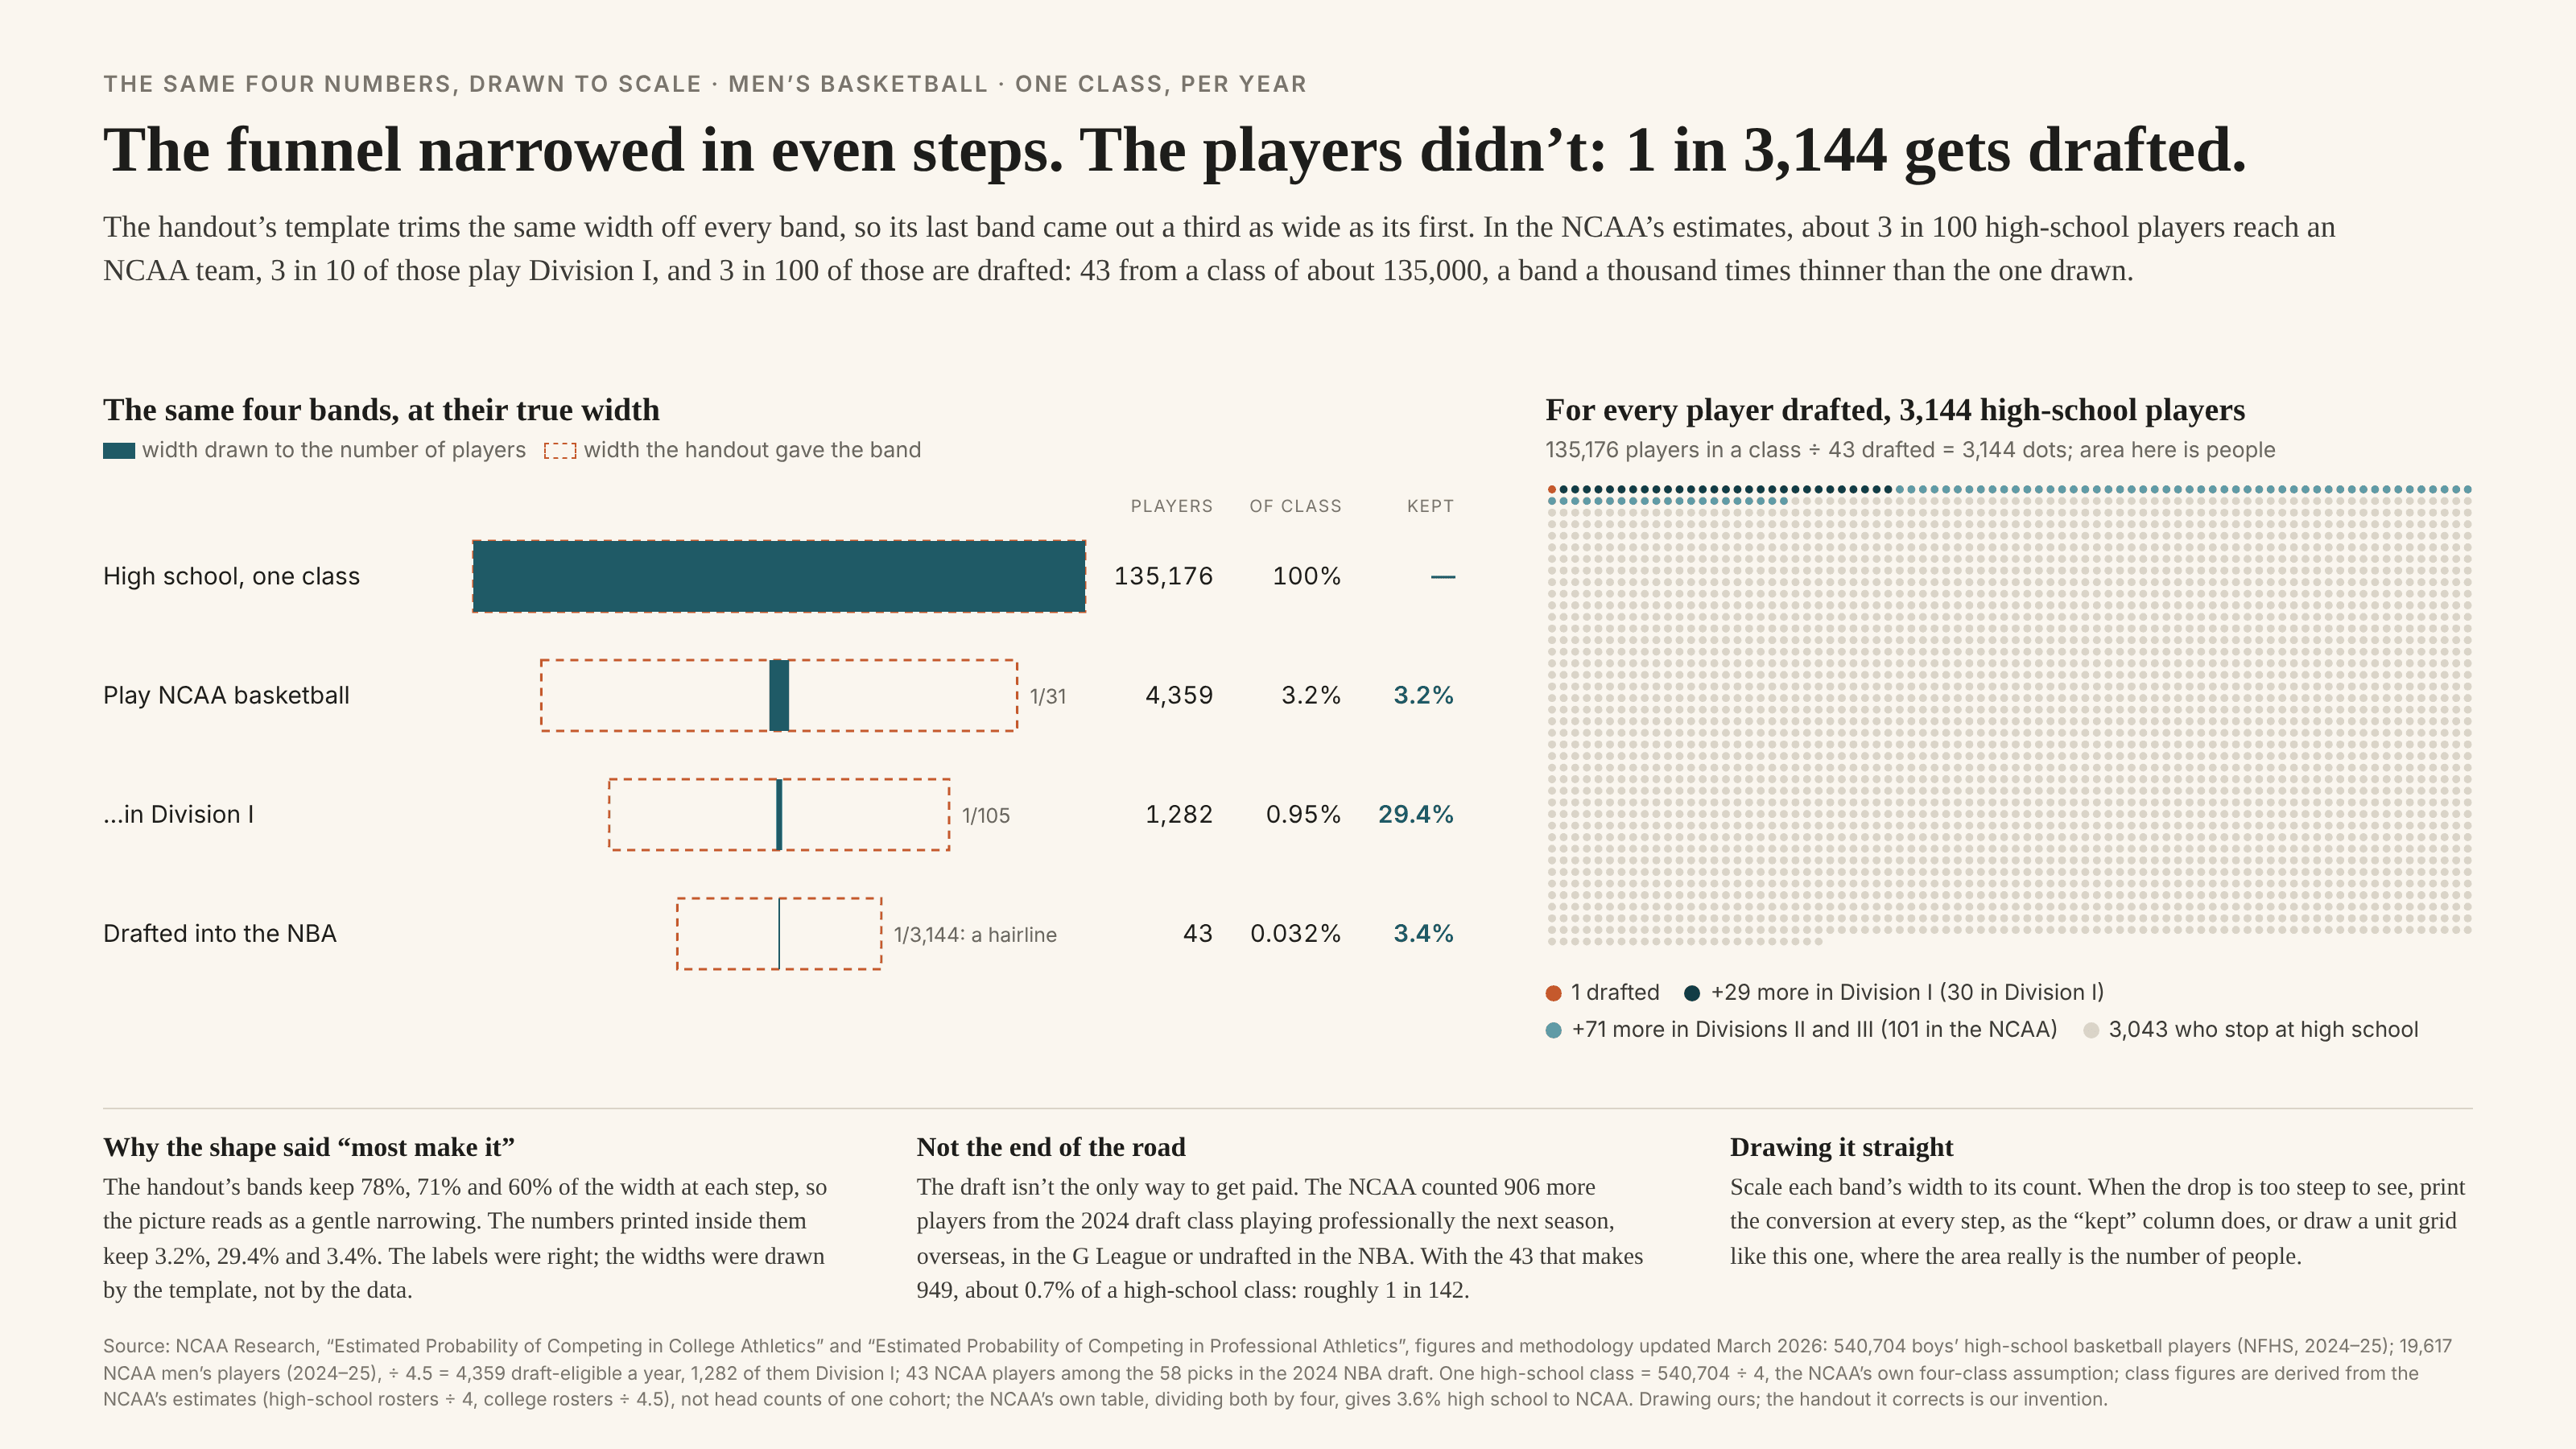
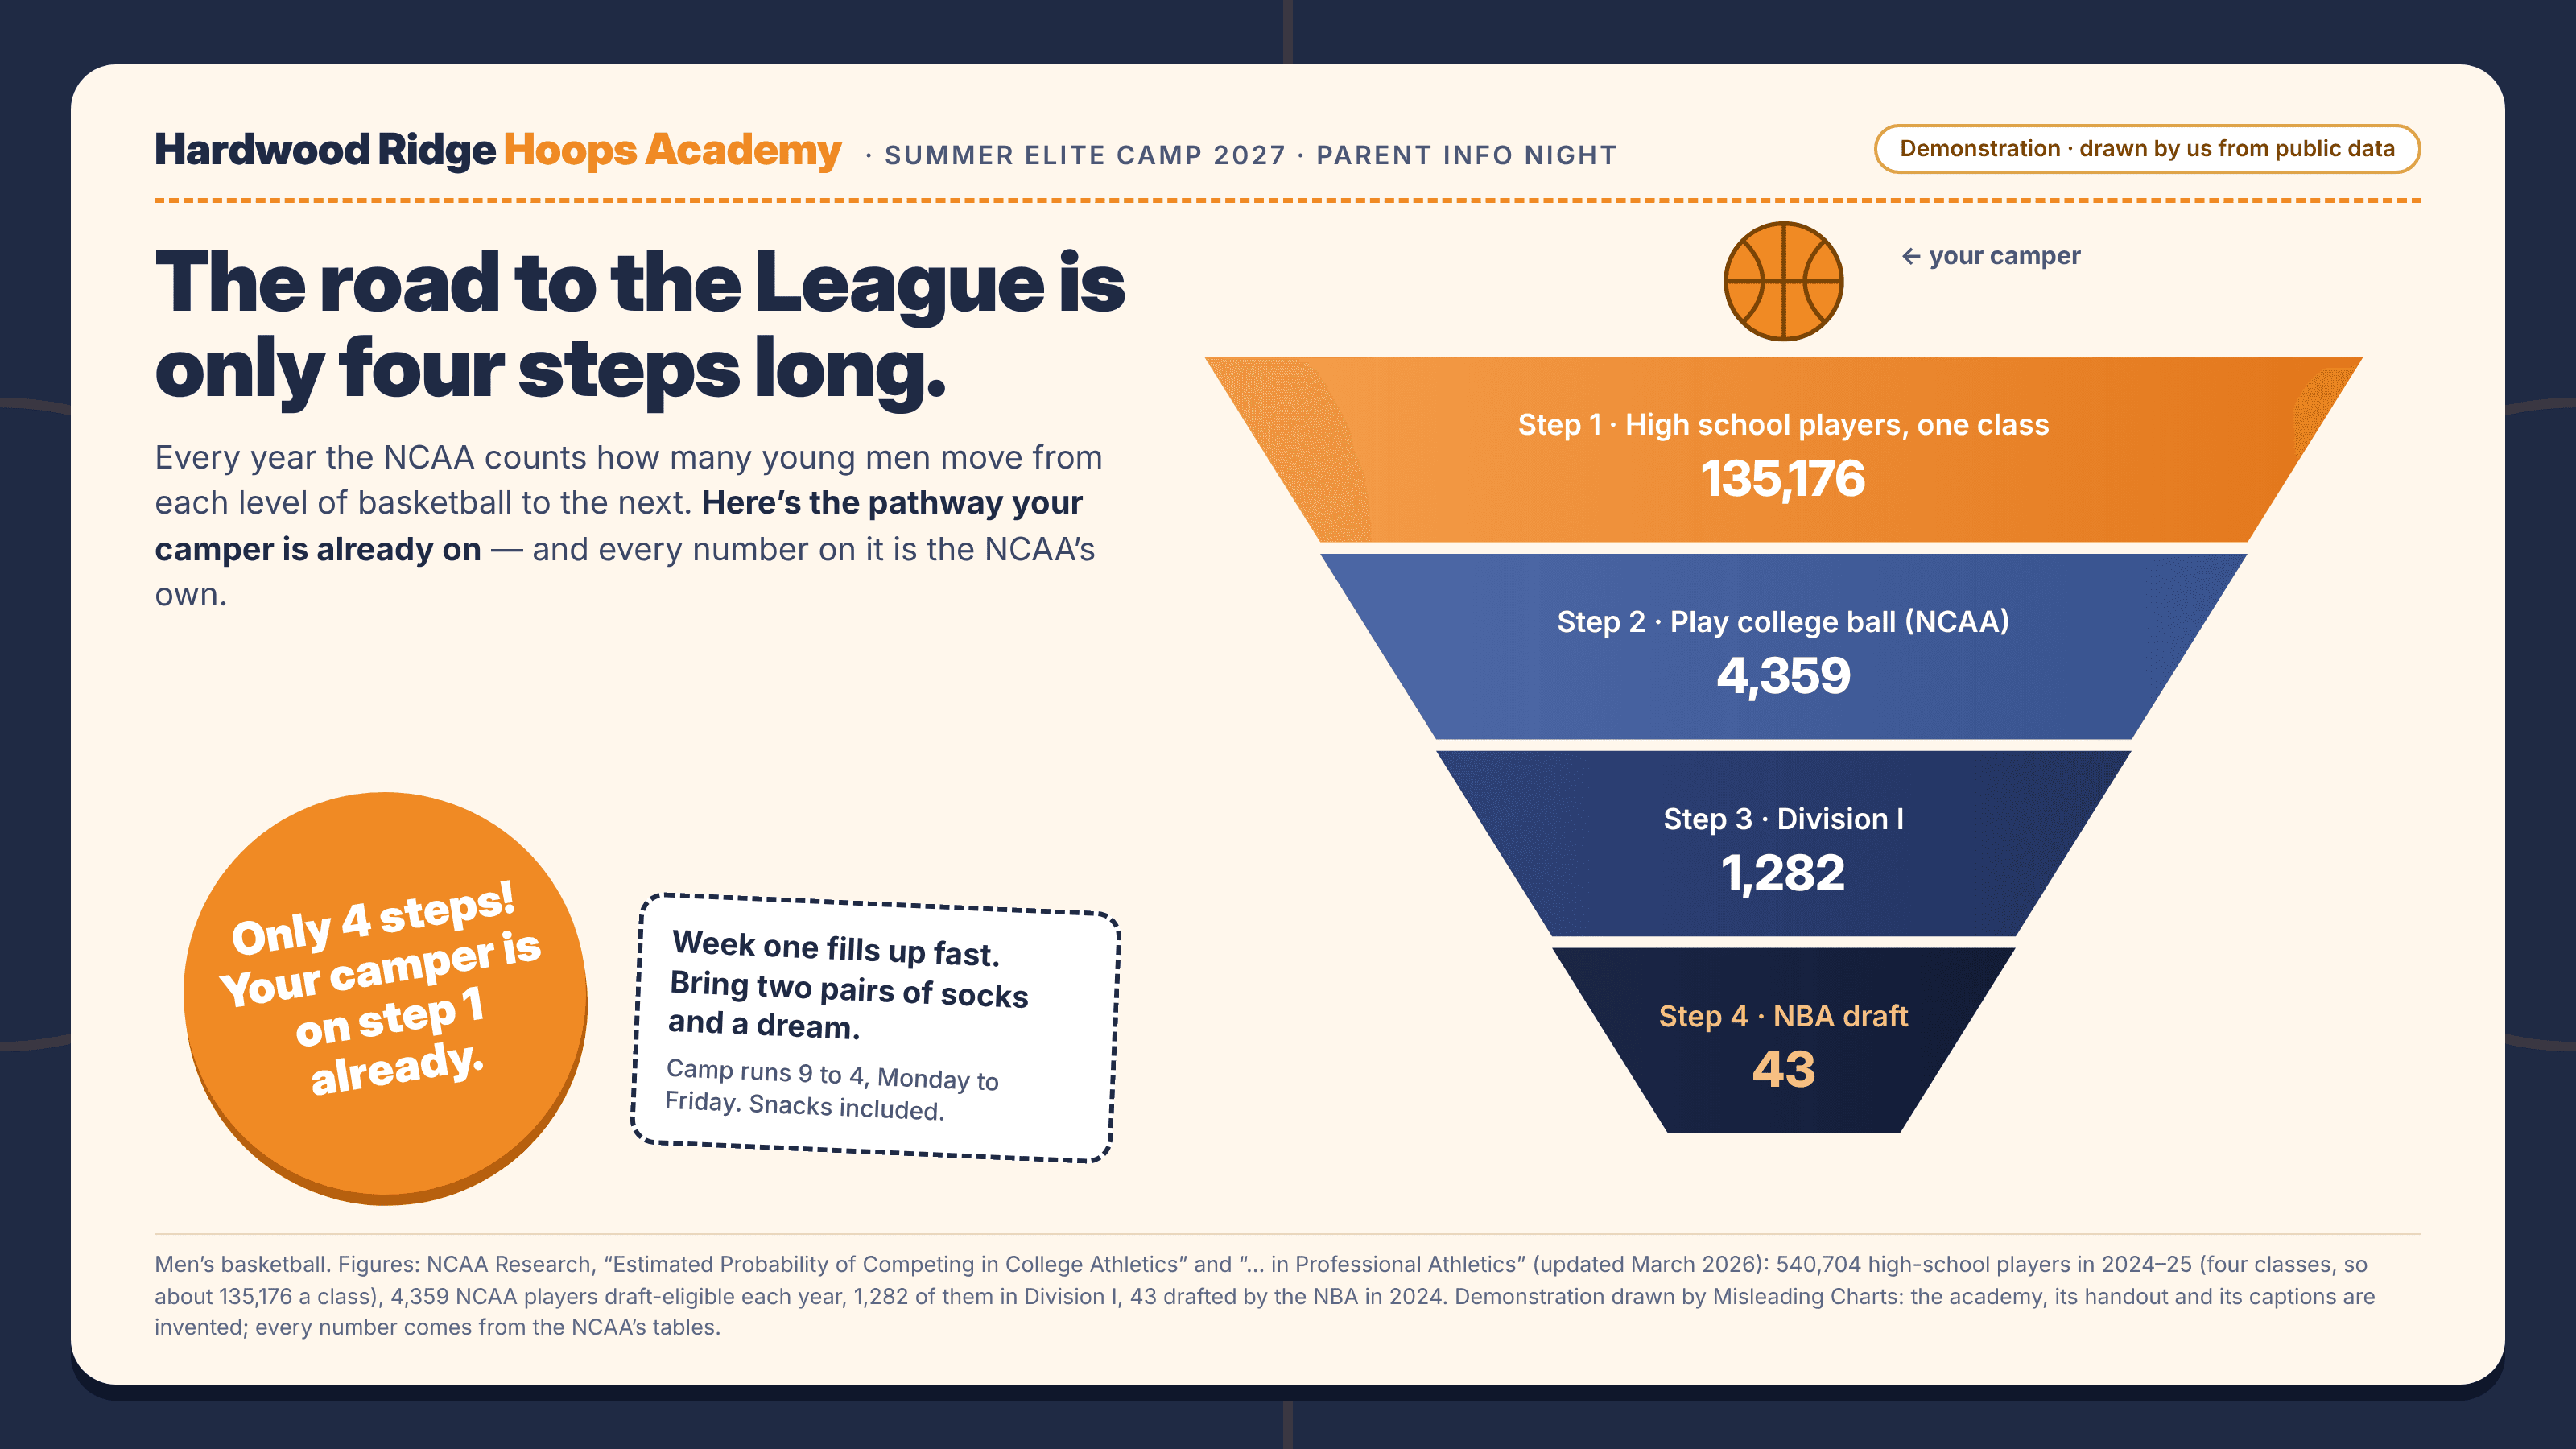
A funnel chart shows a group shrinking stage by stage: visitors to buyers, applicants to hires, players to professionals. Drawn to the data, each band’s width would be its count. Many funnels are not drawn to the data. They come from a slide or infographic template whose bands step in by the same amount every time, and the numbers are typed into them afterwards. The width then encodes the order of the stages, not their size: a stage that keeps 3% of the one before steps in by the same amount as a stage that keeps 90%, and the last band is usually a comfortable fraction of the first, however few people reach it. Every label can be correct and the picture still says “most of you get through”. Unlike the area illusion, where marks are scaled to the data but on the wrong dimension, here they are not scaled at all. And unlike the whole-icon pictogram, which rounds the data to its unit, the template throws the data away and keeps only the rank. Funnels are especially exposed because real funnels are often steep. When each stage keeps a few percent, a true-width drawing makes the bottom bands invisible, and a designer who wants something to put a label on reaches for the template.
How to spot it
- Bands that narrow by the same amount each time. Measure two neighbouring steps: if the widths fall in equal steps while the counts fall by wildly different ratios, the shape is decoration.
- Divide the last label by the first, then compare with the last band’s width over the first. A bottom band a third as wide as the top, labelled with a fraction of a percent, is drawn by the template.
- A neat, symmetrical taper ending in a spout of the same shape as every other band. Real conversion data rarely tapers evenly.
- No conversion rates printed between stages. The template leaves the reader to read the drop from the widths, which are the one thing not taken from the data.
- Separately, check that every band counts the same thing over the same period. A funnel that mixes a four-year roster with one year’s outcome distorts the ratio before the drawing does, and the template hides it.
The fix
Scale each band’s width to its count, and say so. If the drop is so steep that later bands vanish, do not reach for a template; print the share kept at every step beside the band, draw the stages as bars on a log axis with the scale labelled, or use a unit grid in which each dot is a person, so the area really is the number. For one headline figure, “1 in 3,000” in words beats any taper. Keep the decorative funnel for diagrams that show the order of steps with no numbers attached.
In the gallery