All techniques
Framing & context
Phantom precision
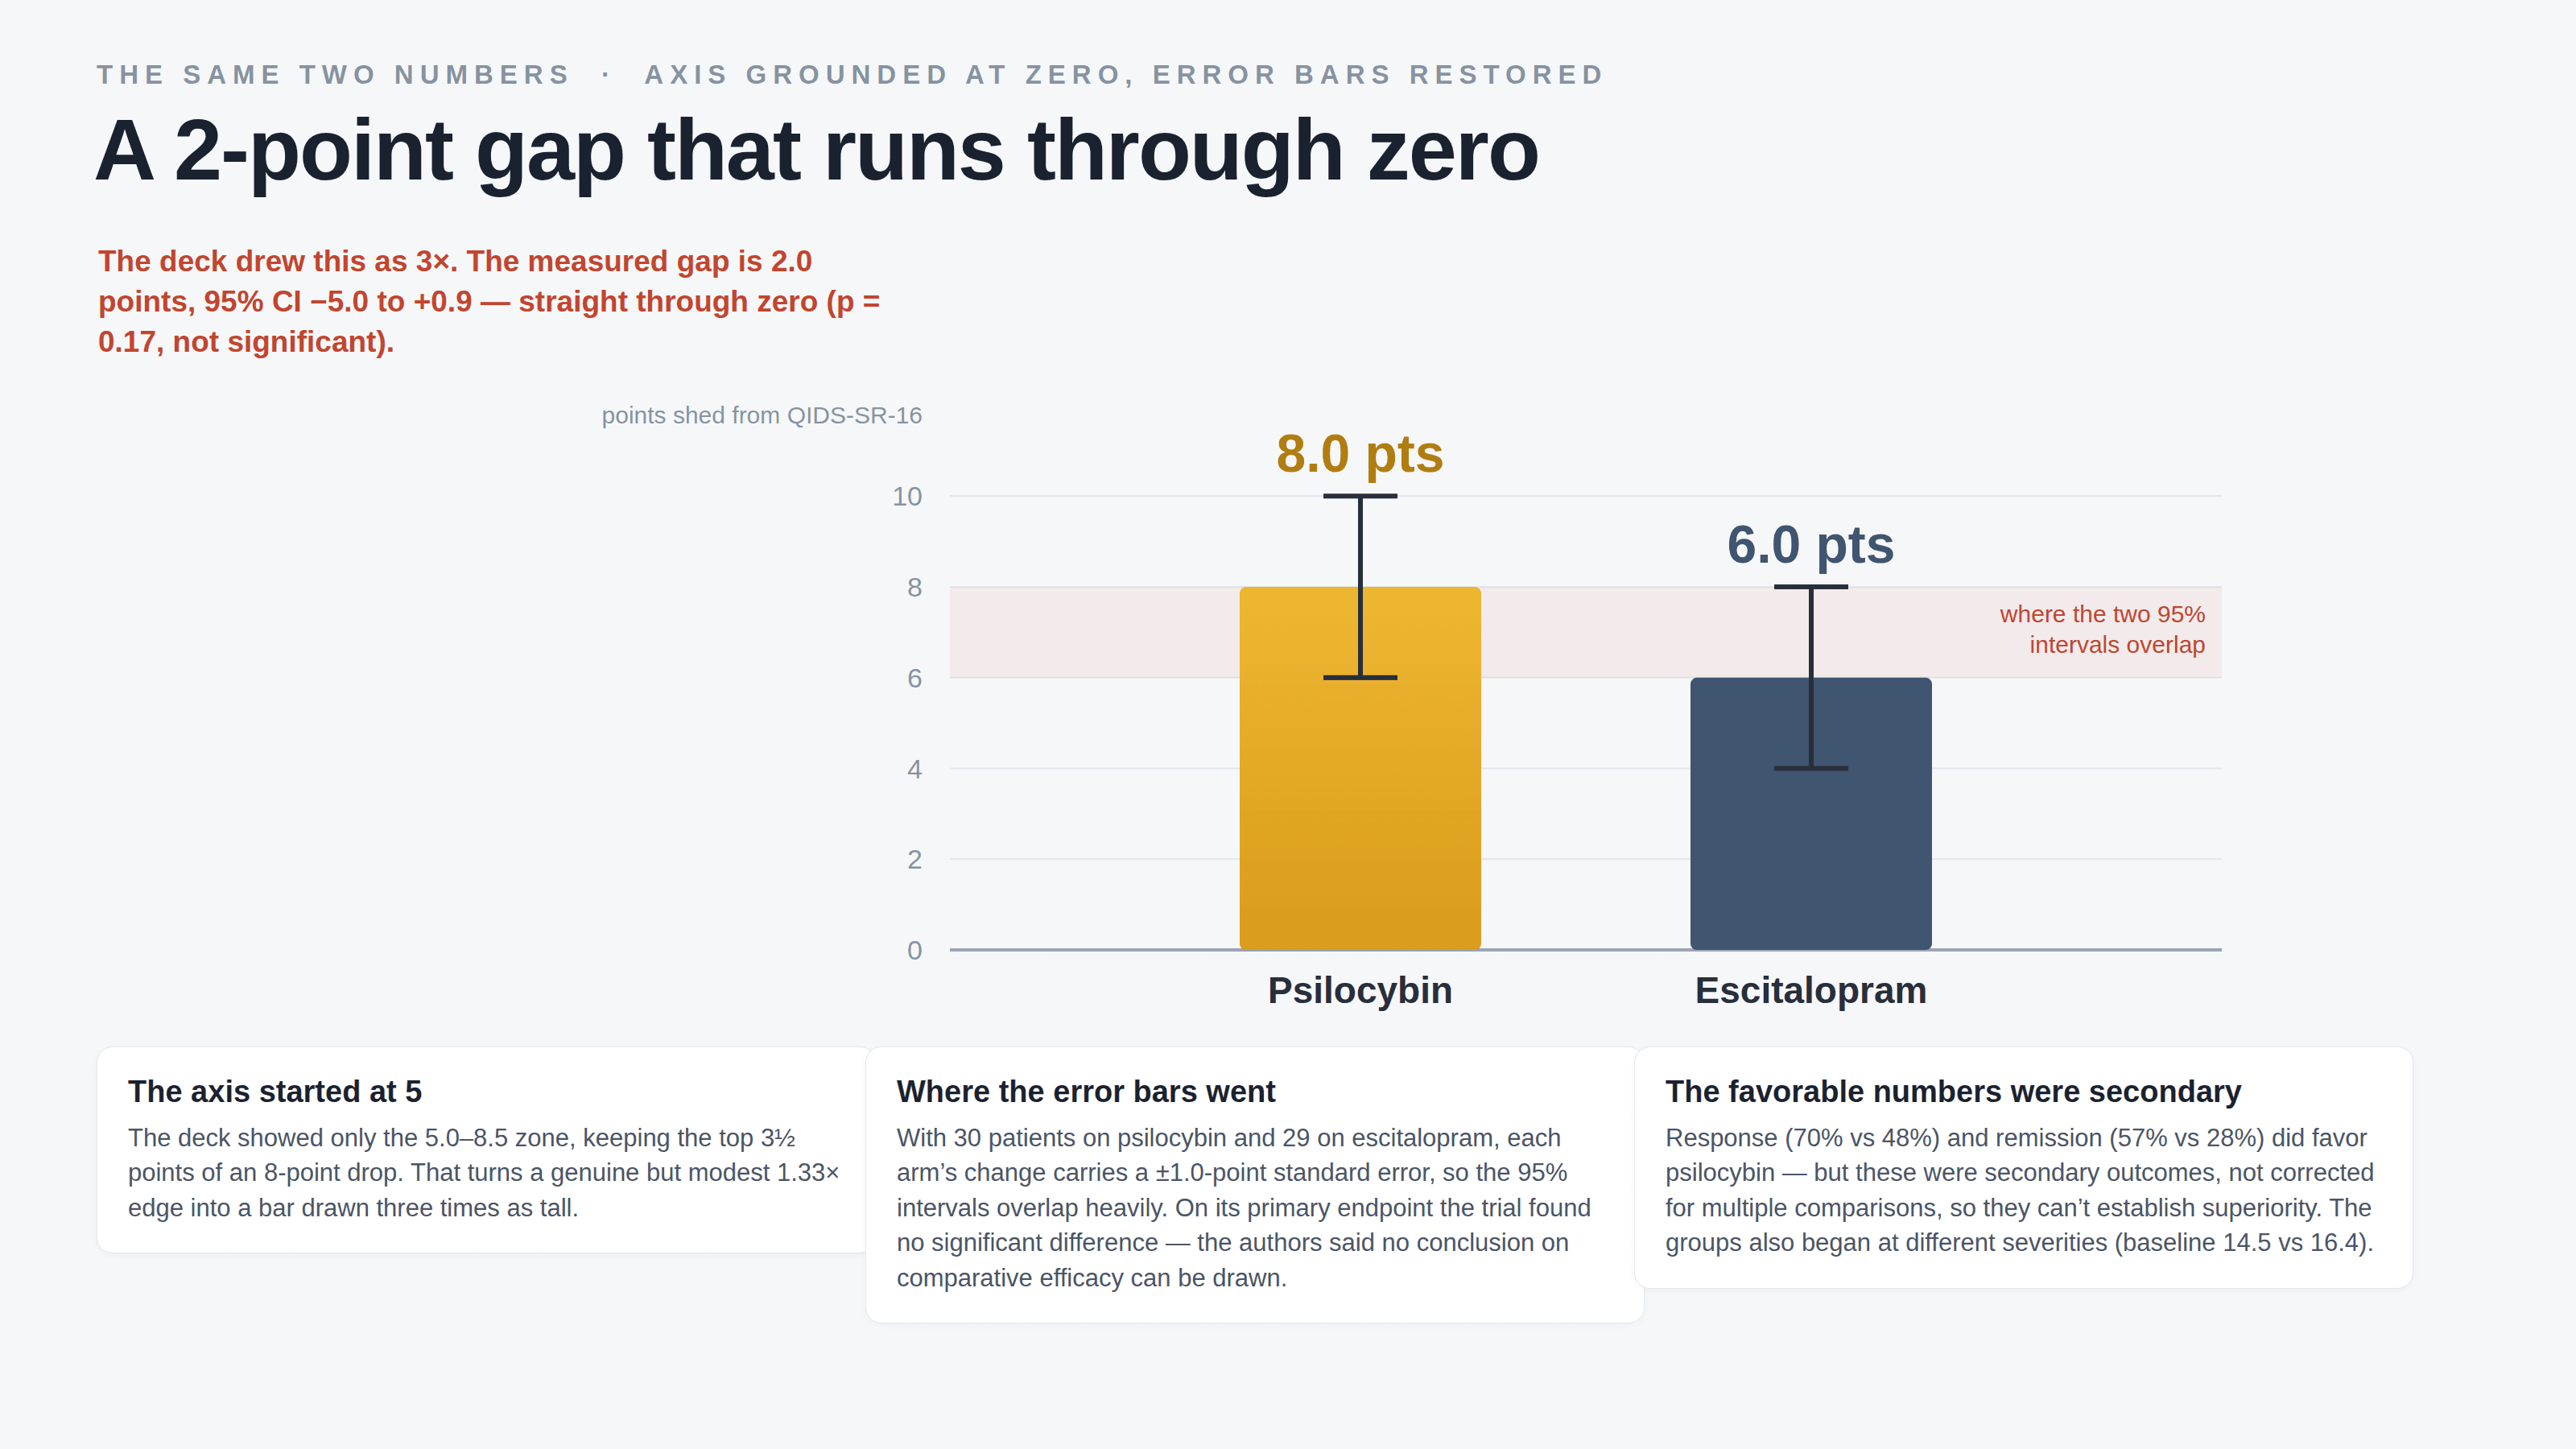
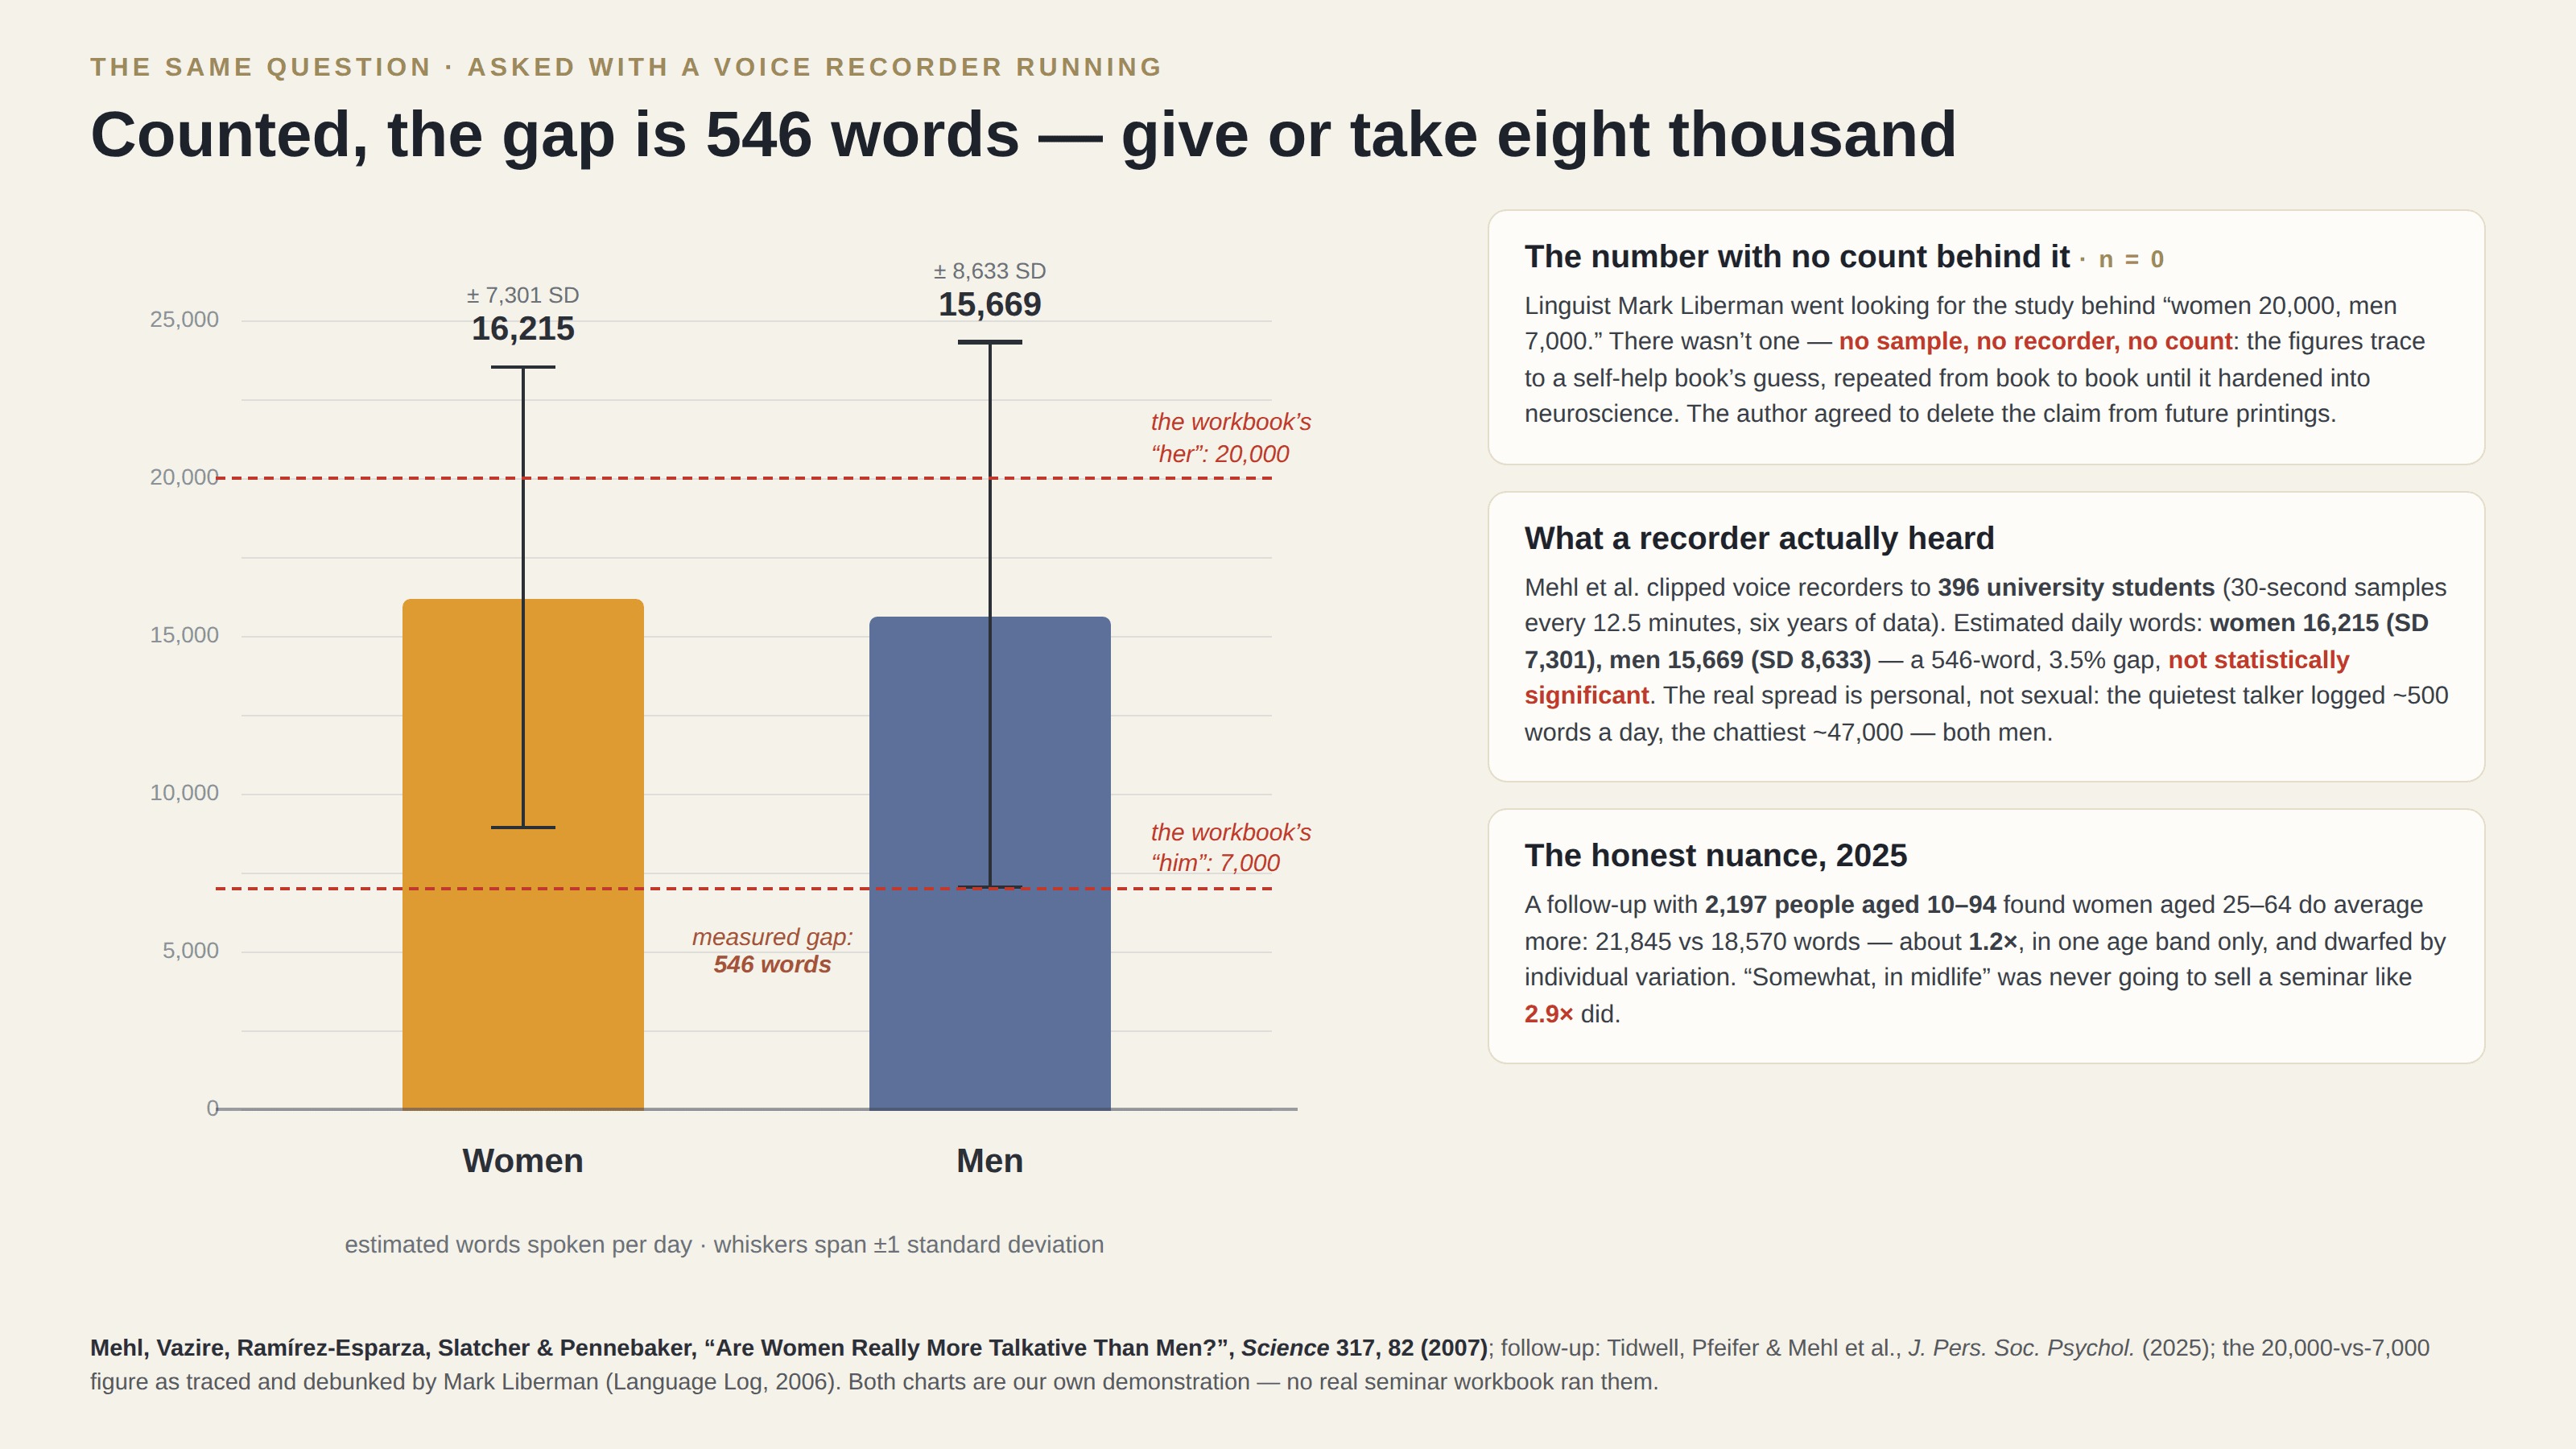
n = 6, error bars sold separately.
a.k.a. missing uncertainty · small-sample swagger
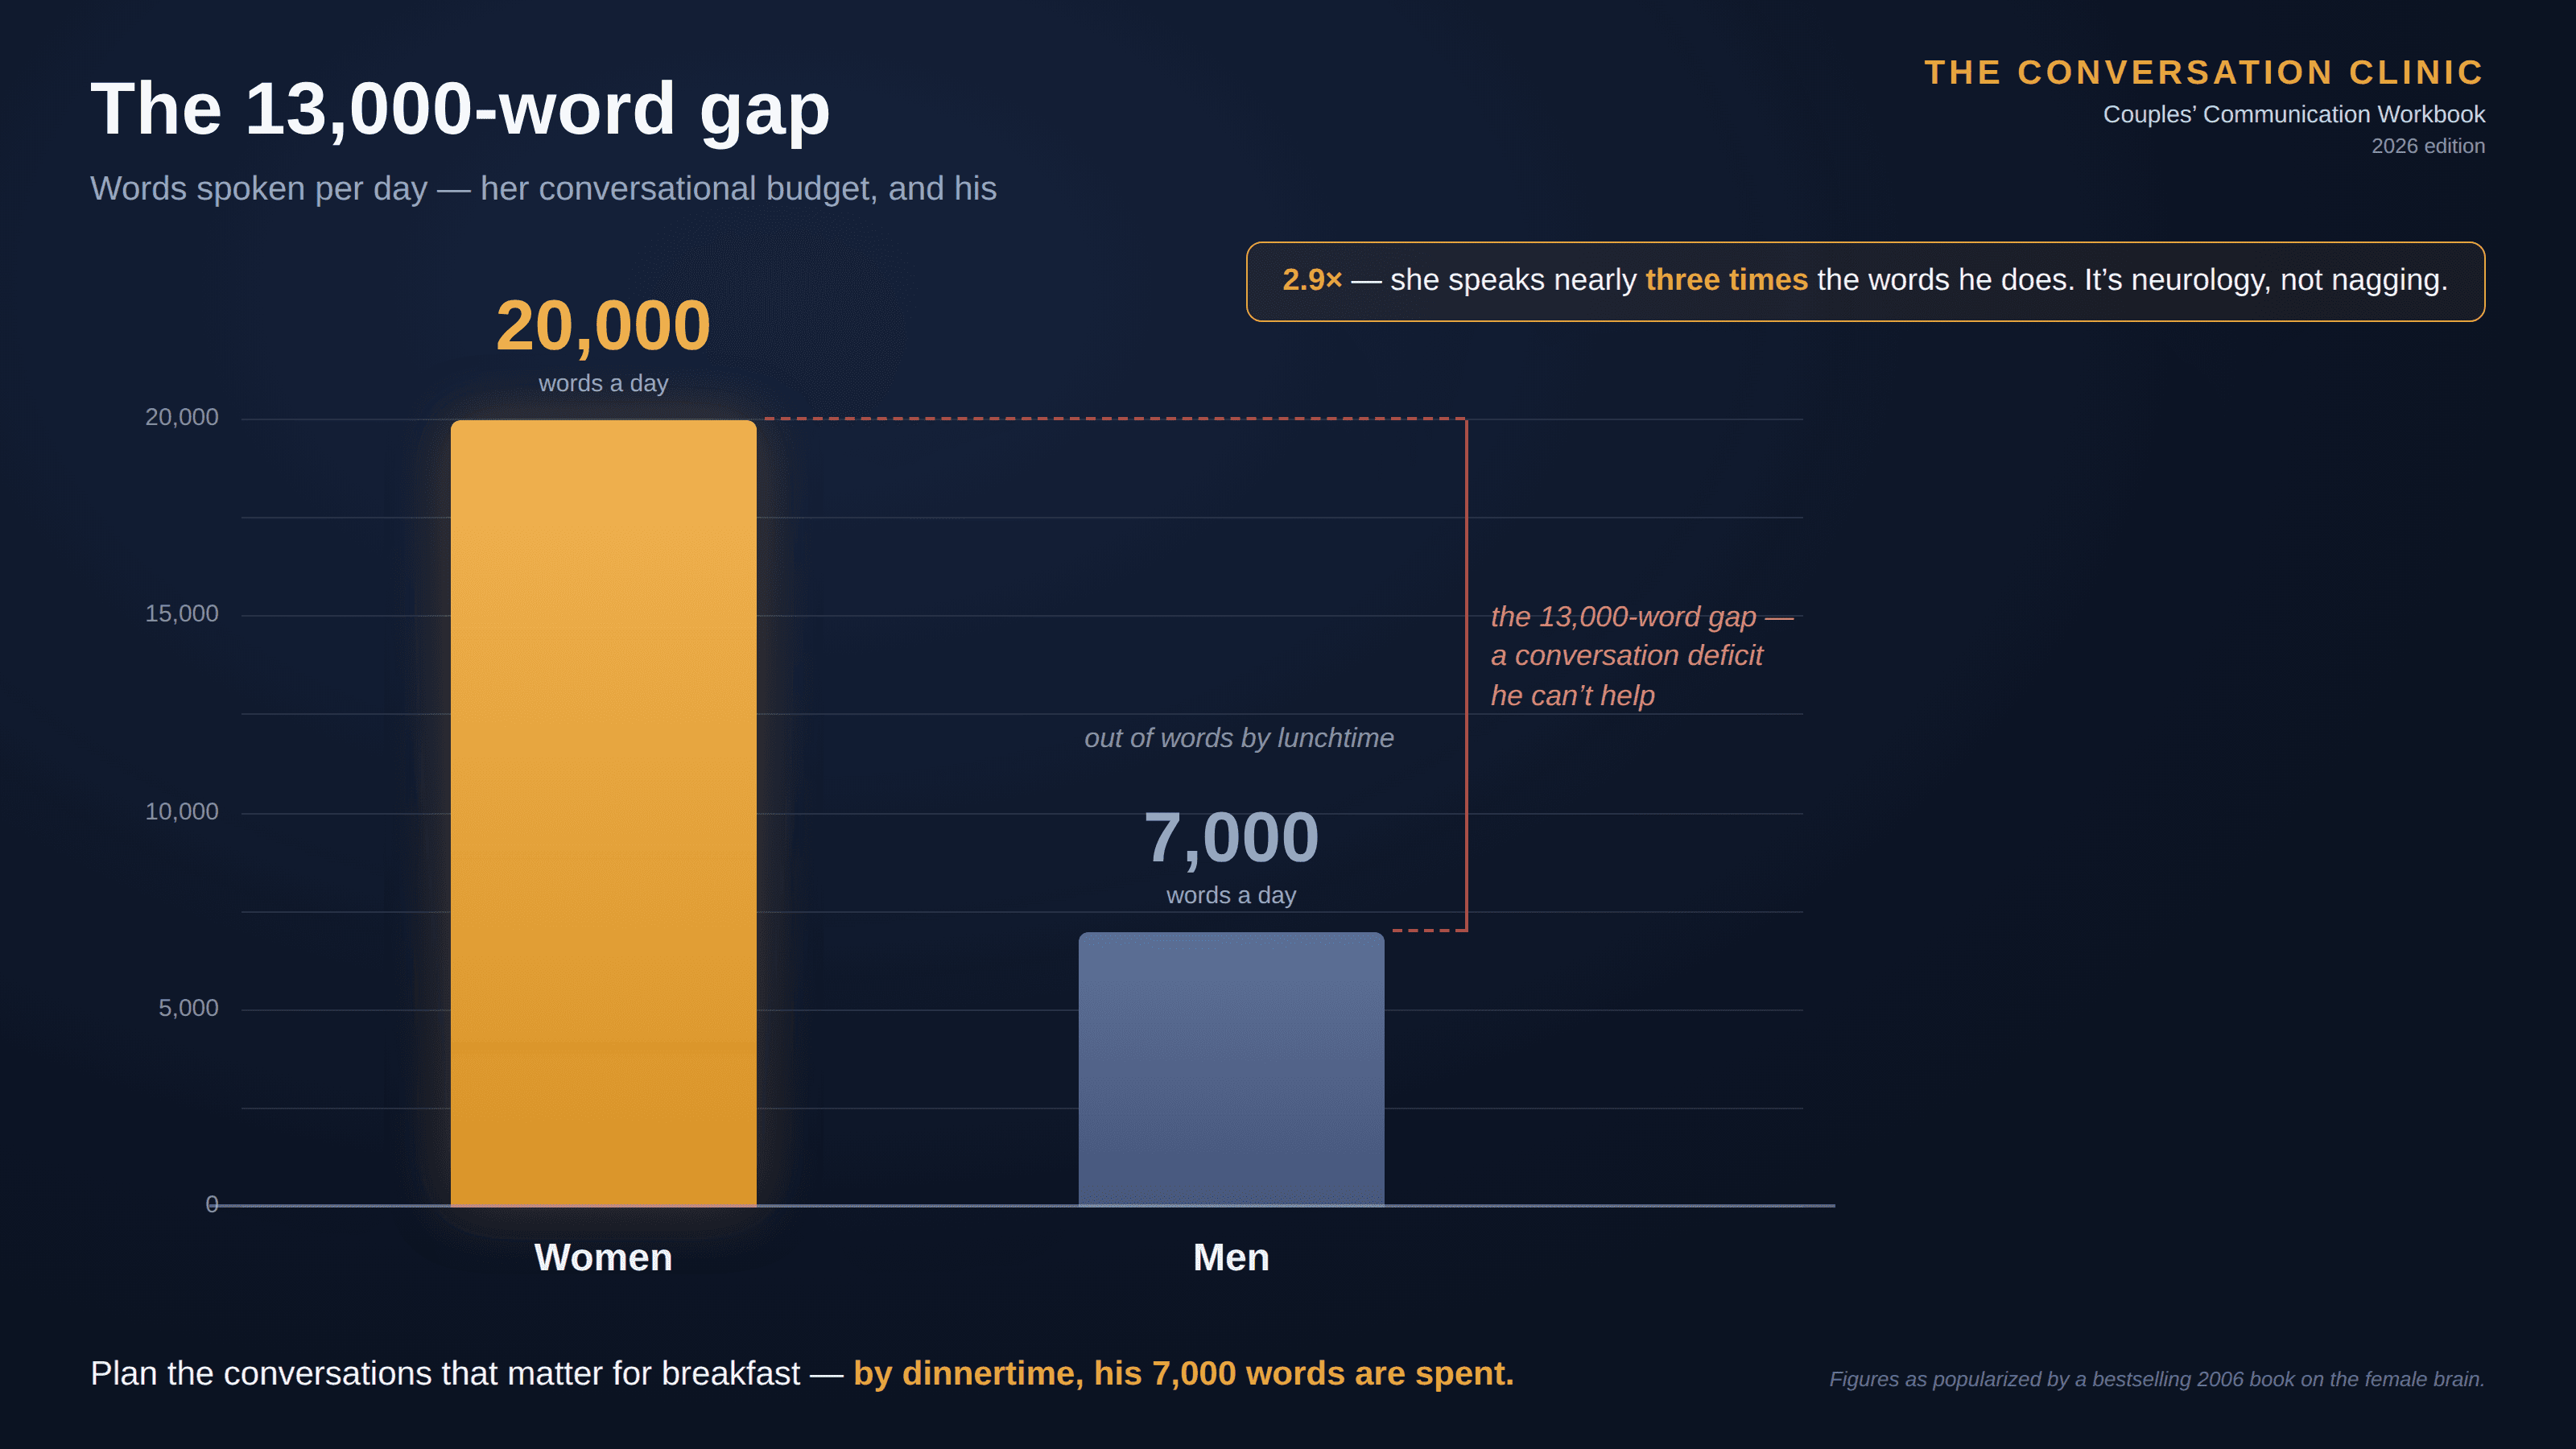
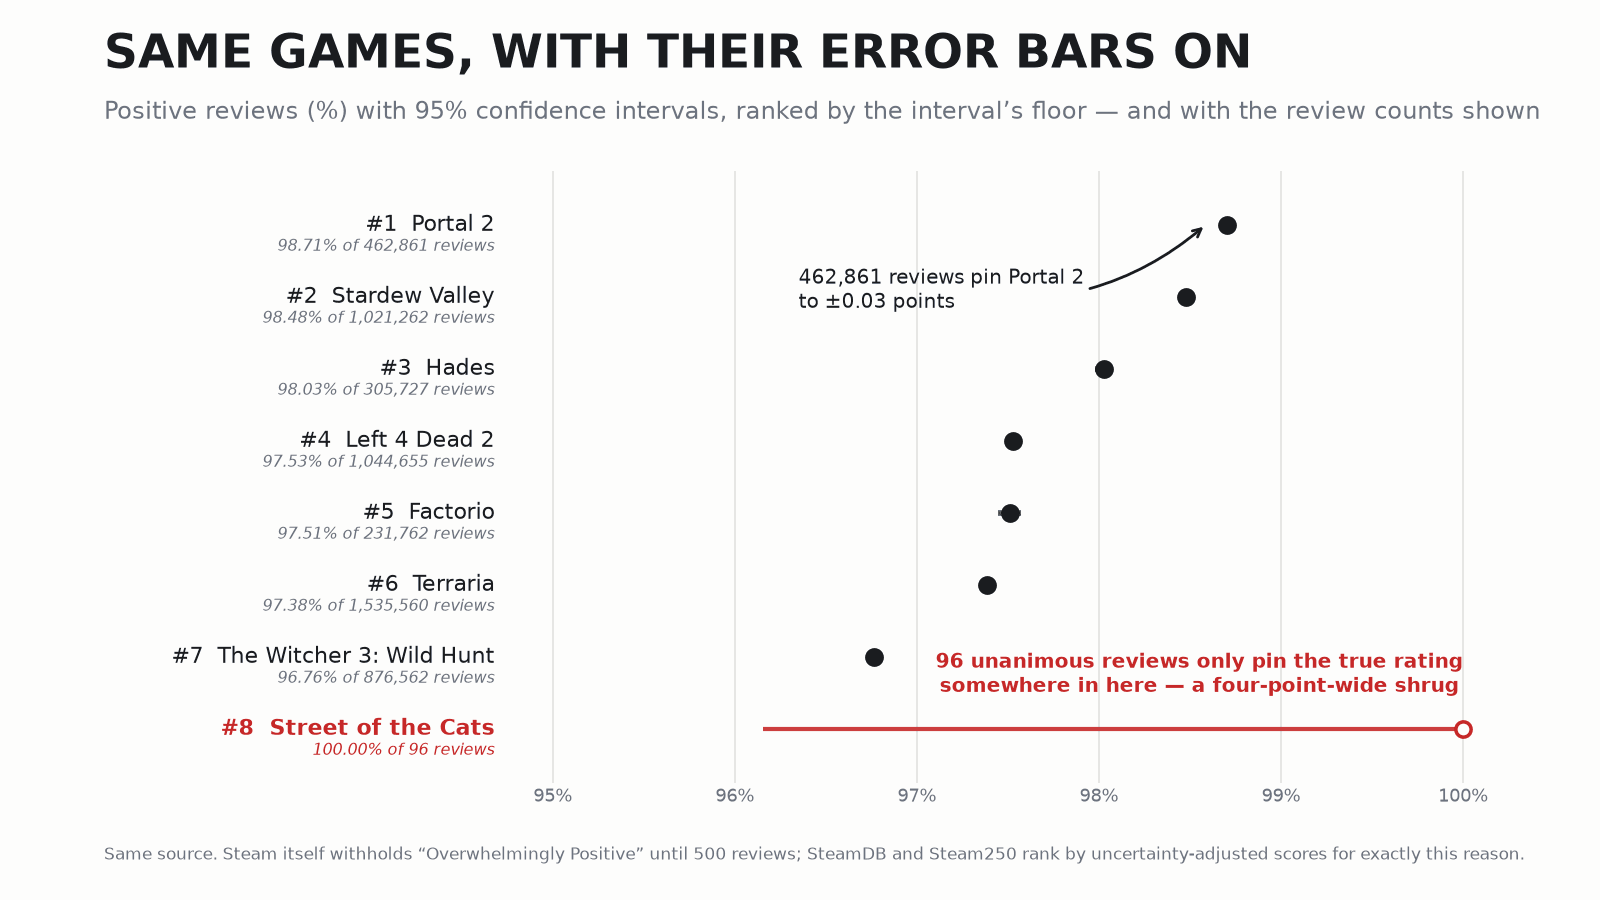
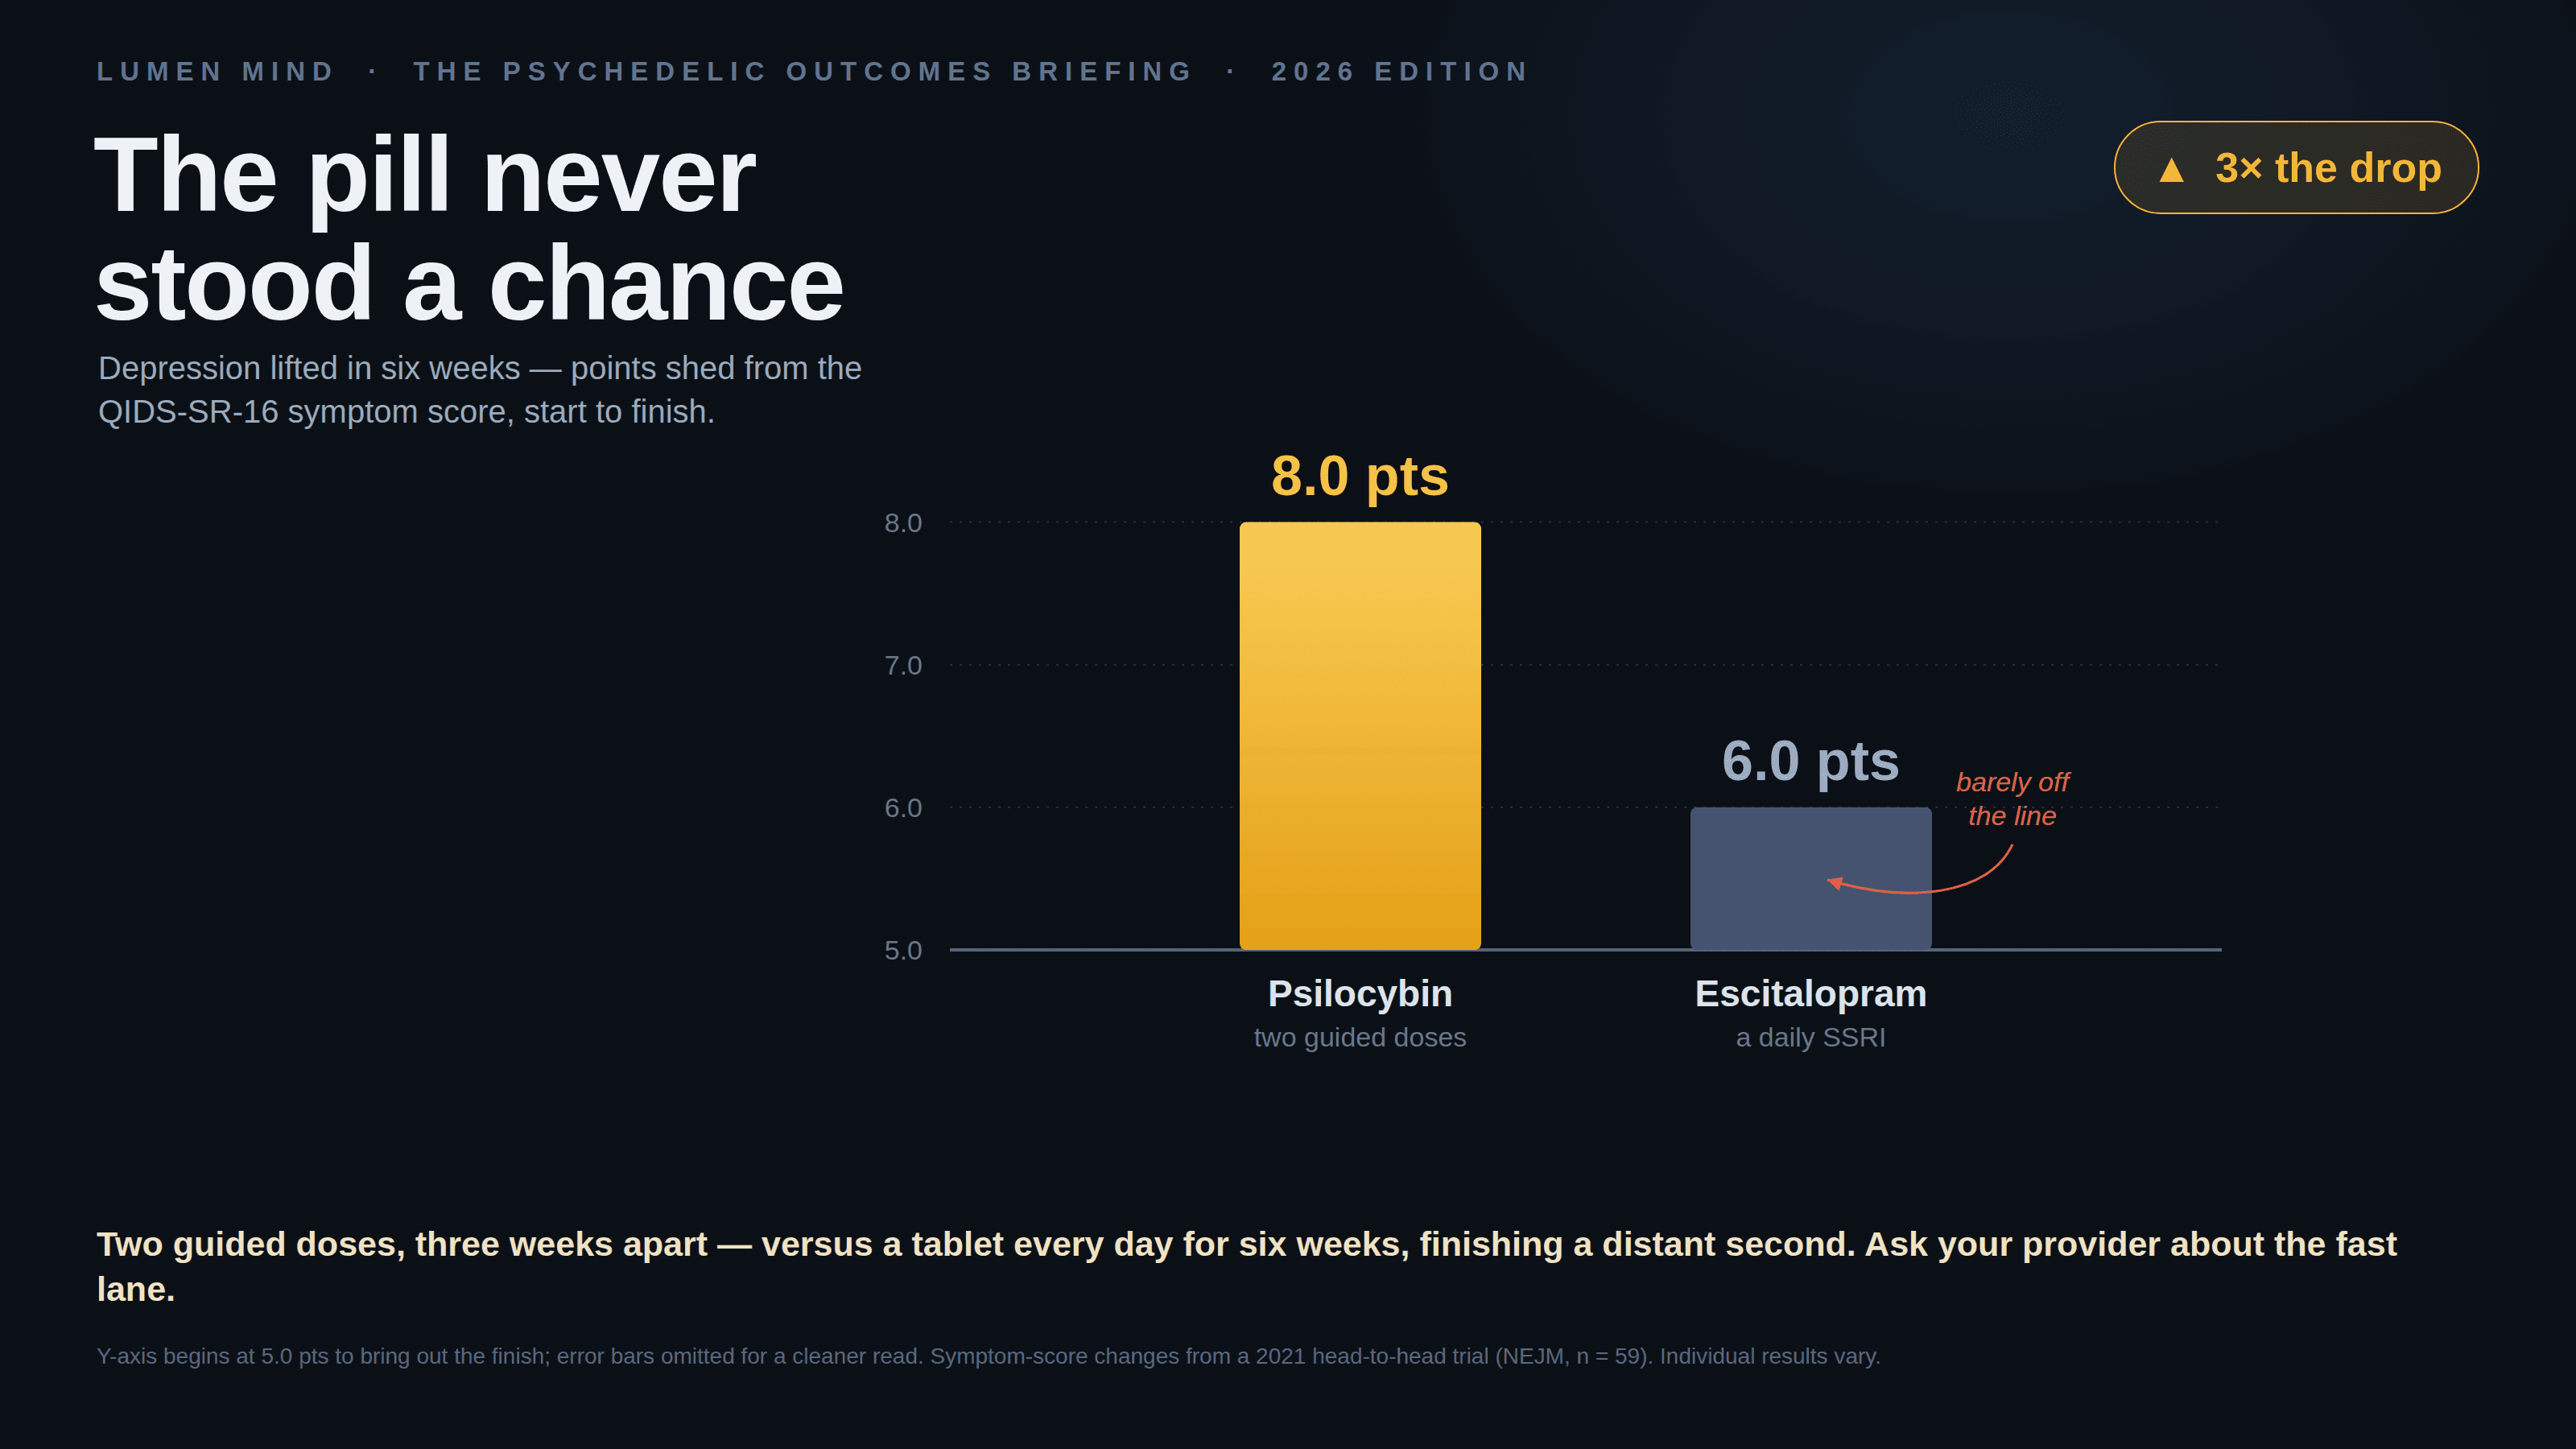
A crisp bar chart looks exactly as confident whether it rests on six million data points or six. Drop the error bars and noise dresses up as signal.
How to spot it
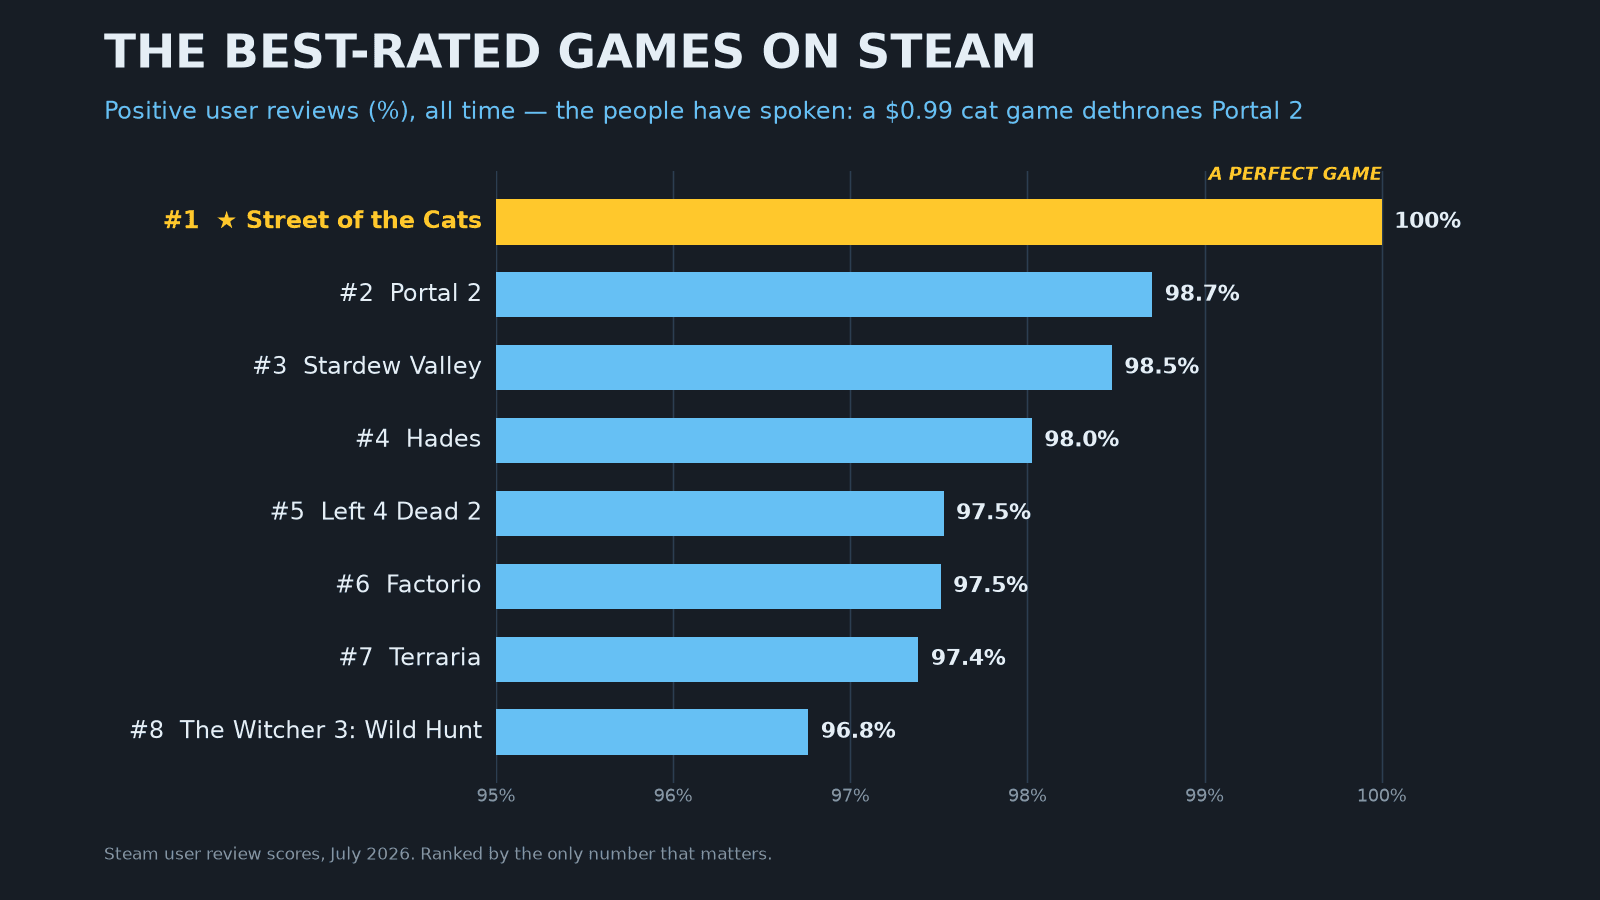
- No sample size mentioned anywhere.
- Point estimates with no intervals or error bars.
- Differences smaller than the likely noise, treated as findings.
The fix
Show the n, show the uncertainty, and round to what you actually know.