All techniques
Size & scale
The whole-icon pictogram
A row of icons can only count in whole icons.
a.k.a. rounded pictogram · icon rounding · unit-chart rounding · icon array rounding · the missing half-icon
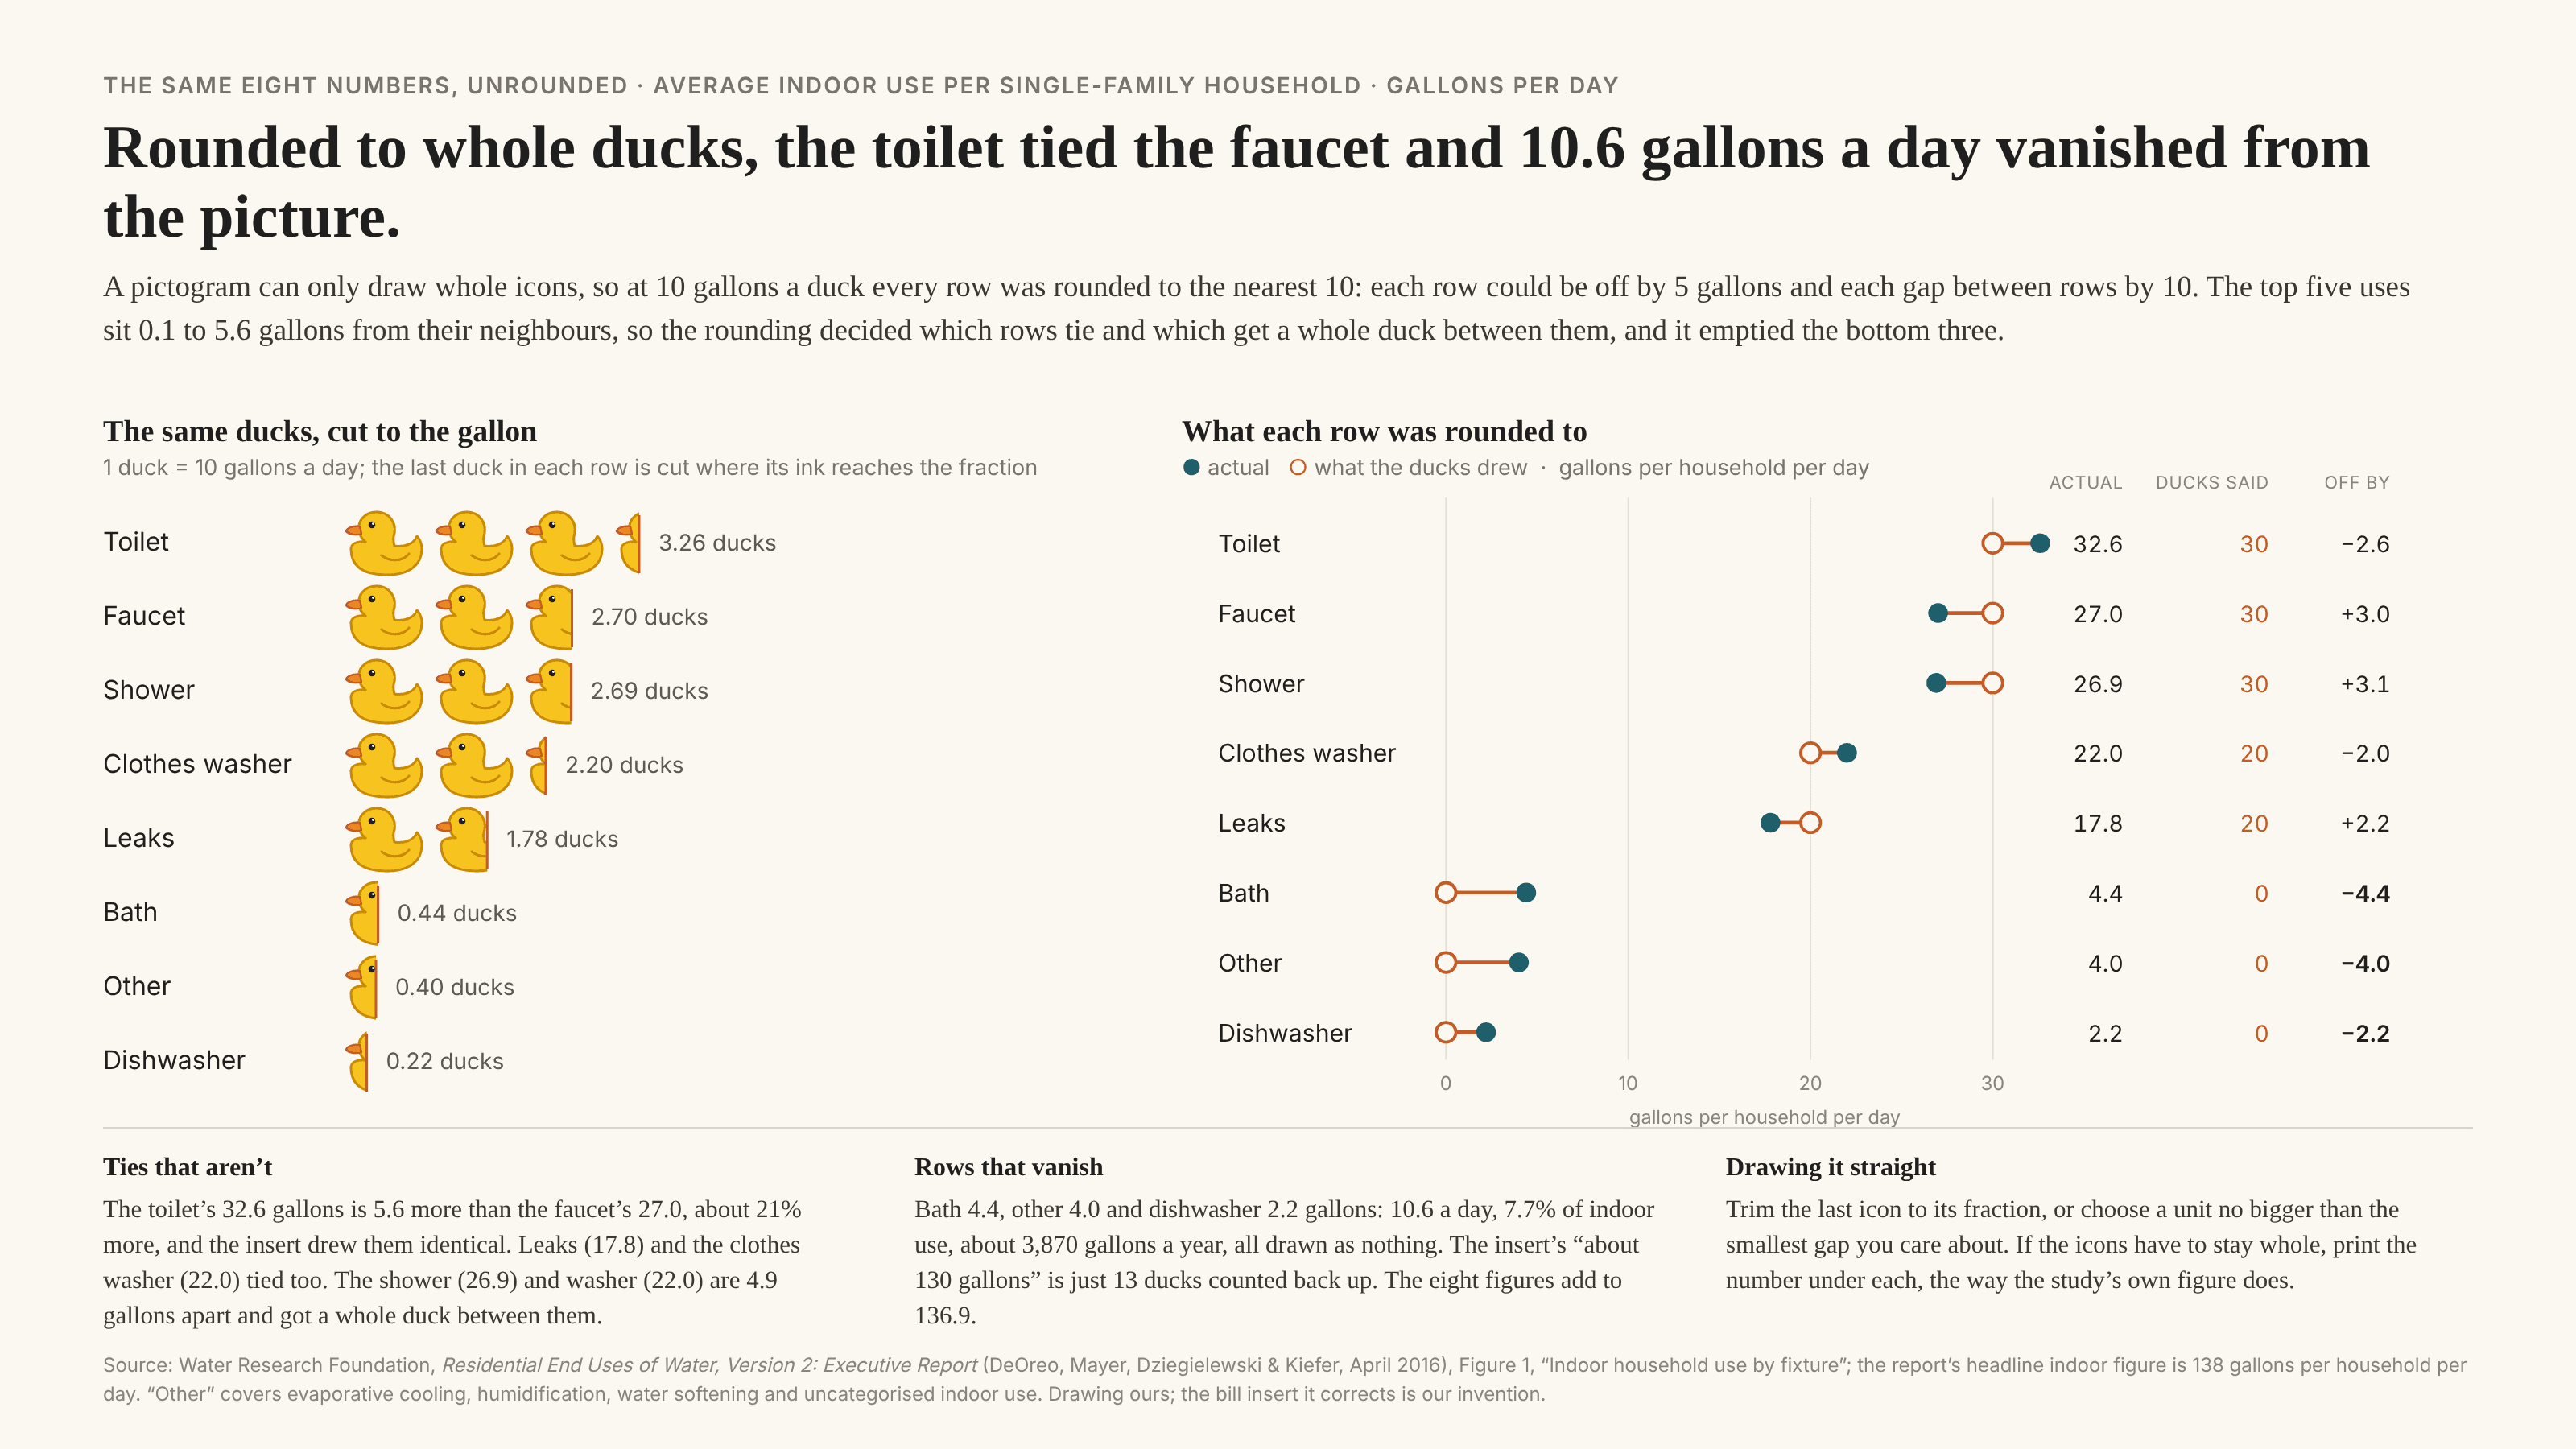
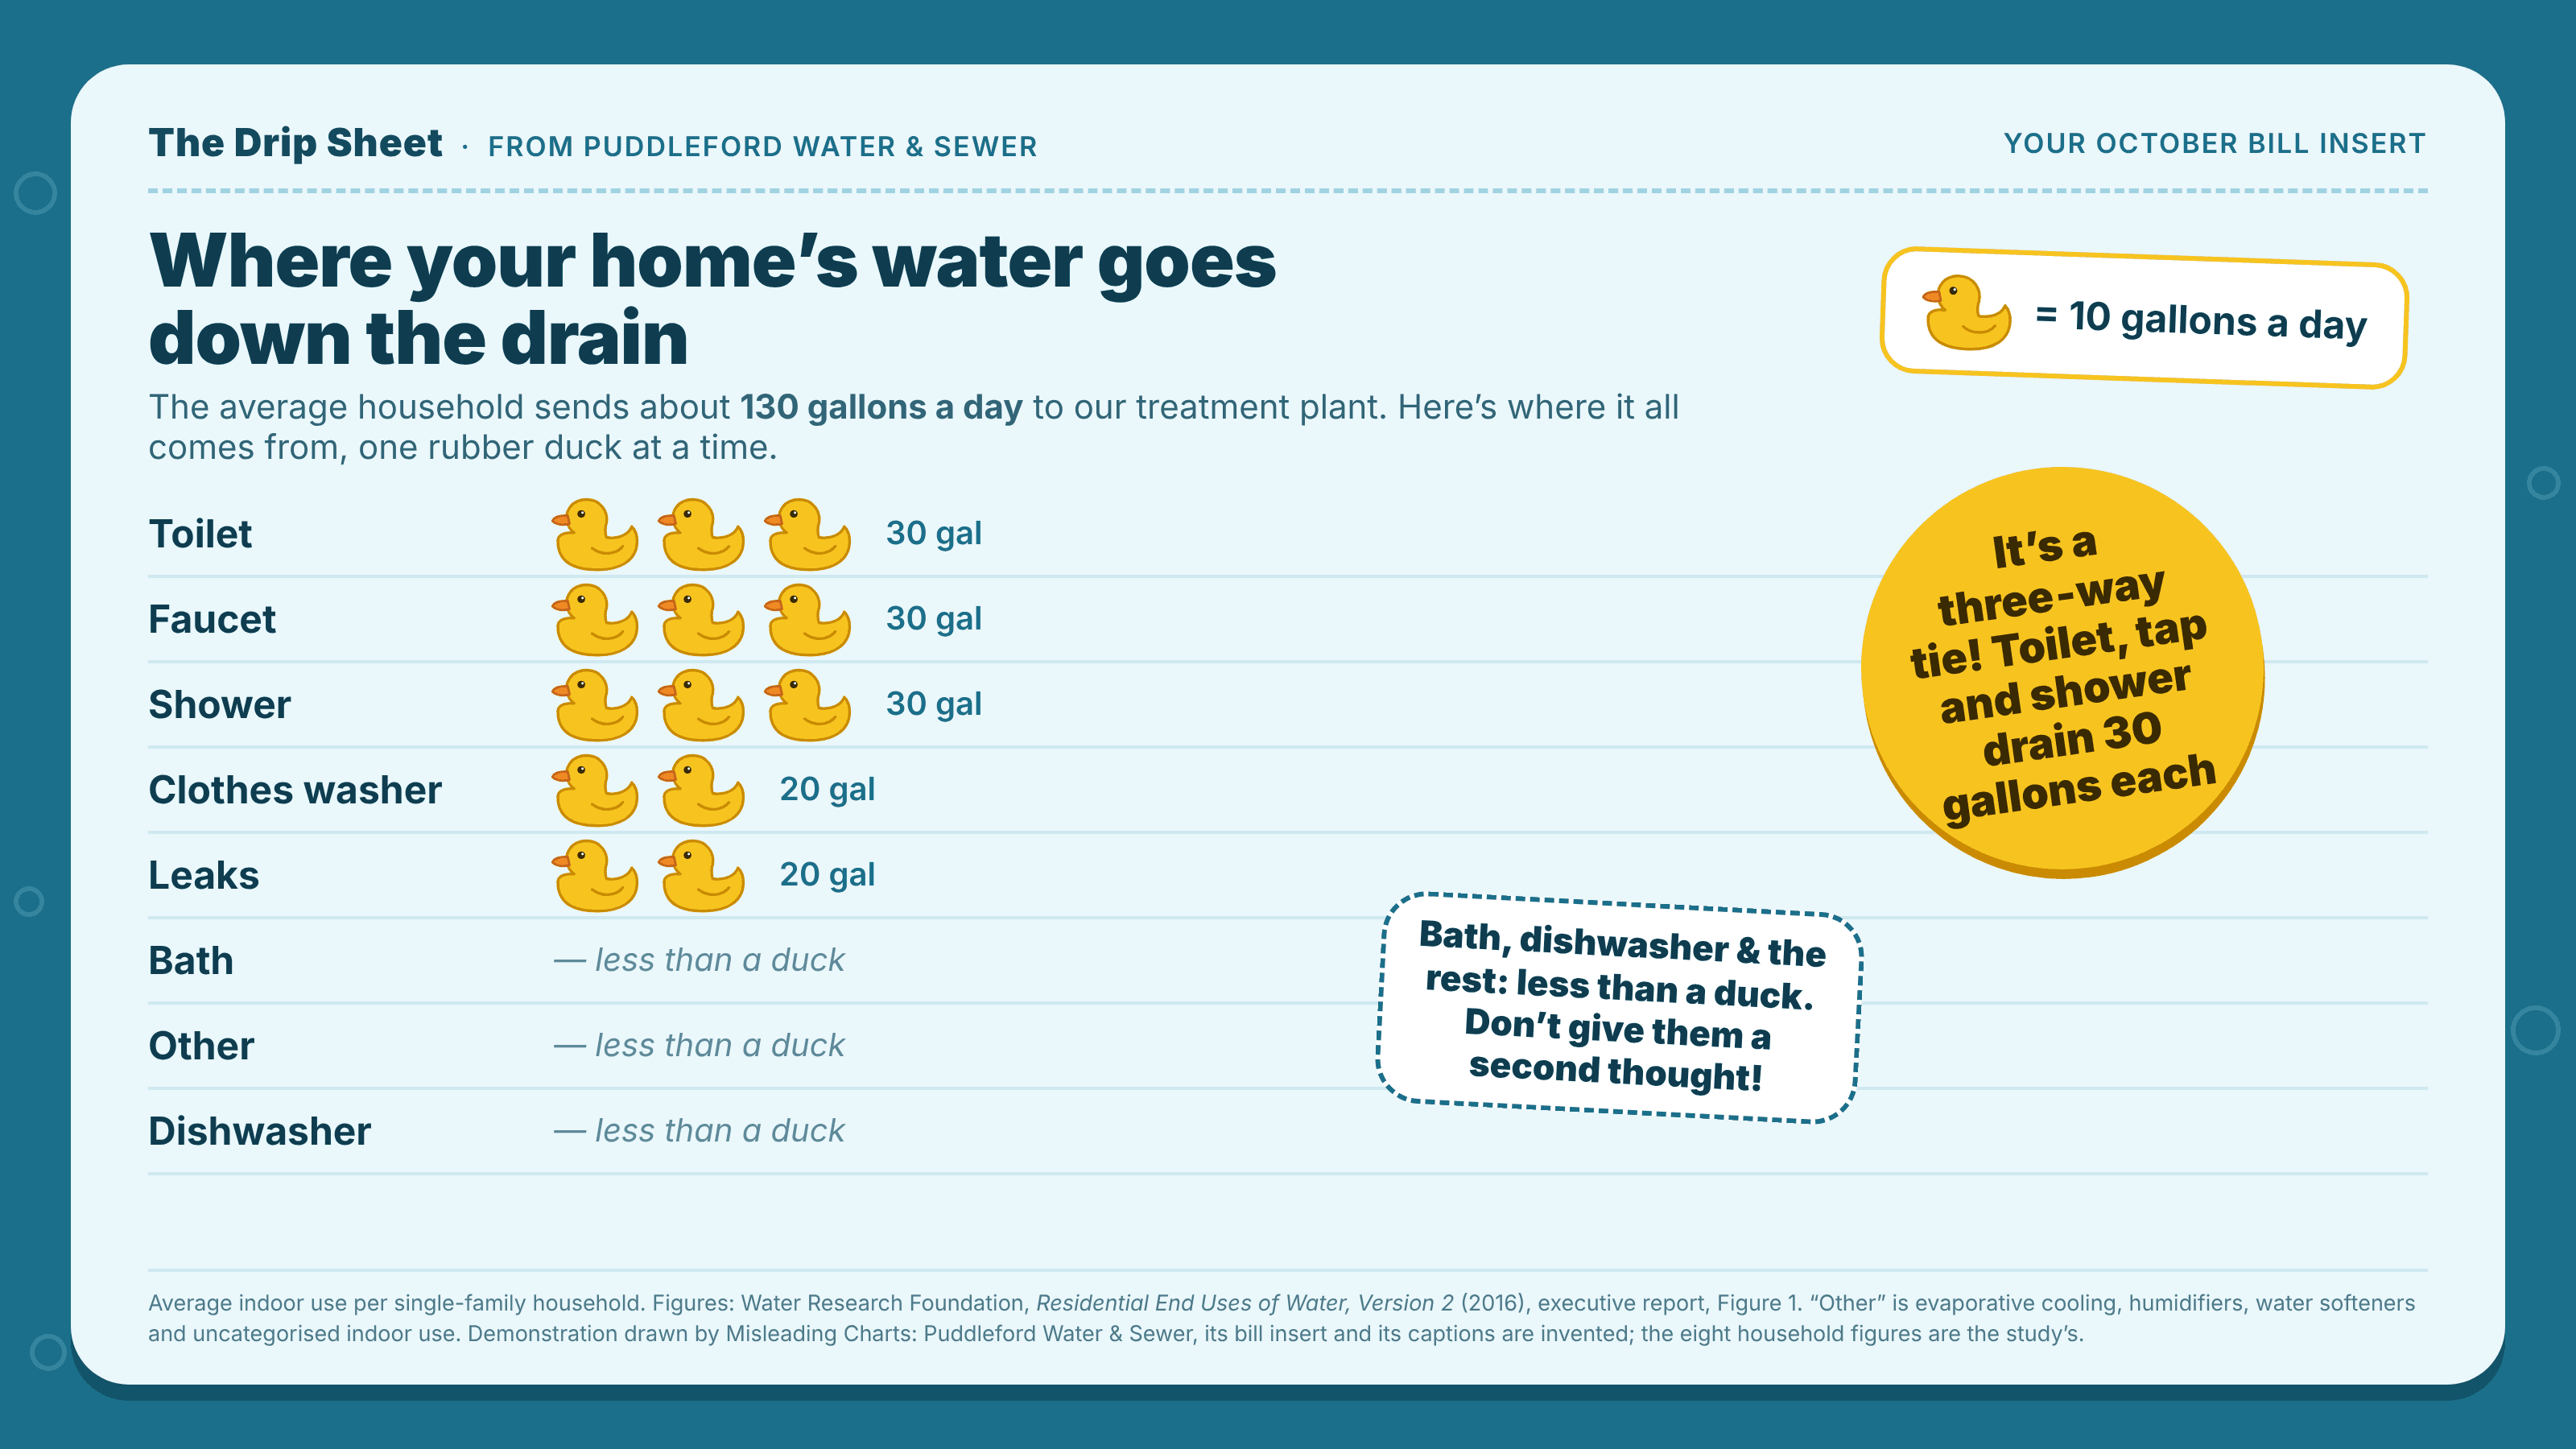
A pictogram shows a quantity as a count of identical icons: one bucket for every ten gallons, one figure for every million people. It looks more literal than a bar, because you can count the icons. But a whole icon is also the smallest step the chart can draw, so unless someone trims the last icon to size, every value is quietly rounded to the nearest unit before anyone sees it. Each row can then be off by up to half an icon, and nothing on the page says which way, so the gap between two rows can be off by up to a whole icon. Whenever the real gaps are smaller than one icon, the rounding decides the picture: values almost an icon apart can come out identical, values almost level can come out a whole icon apart, and anything smaller than half an icon is drawn as nothing at all. Being countable makes it worse, not better. Readers can count the icons back into a total, and the total is just the rounding added up. Unlike the area illusion, the icons do not change size; the problem is the unit, not the ink. And it is the heaped digit done by the drawing rather than the recording: the values were measured finely and snapped to a lattice on the way to the page.
How to spot it
- Look for any trimmed icon. If every row ends on a whole one, every row was probably rounded.
- Read the key. Half of it is how far any row can be from the truth, and all of it is how far any gap between two rows can be, so compare the key with the gaps.
- Rows that come out level, especially three or more at once. Exact ties are uncommon in measured data, and three at once is a strong tell.
- Empty rows, or a row marked “less than one”. Small items that disappear are an artefact of the unit.
- A total in the copy that is a round multiple of the unit. It was probably counted off the icons.
The fix
Trim the last icon in each row to its true fraction, so 2.7 icons draws as two and seven-tenths, and cut it by area rather than width if the icon is an irregular shape. Or pick a unit no bigger than the smallest difference the chart is about. If the icons have to stay whole for style, keep them decorative: draw each item once and print its number beside it. And when the comparison matters, use a bar or a dot plot, which can stop anywhere and never has to round.
In the gallery